

Visual data: a new tool to improve the presentation of clinical trial results
- PMID: 31778465
- PMCID: PMC6896661
- DOI: 10.31744/einstein_journal/2020AE4729
Visual data: a new tool to improve the presentation of clinical trial results
Abstract
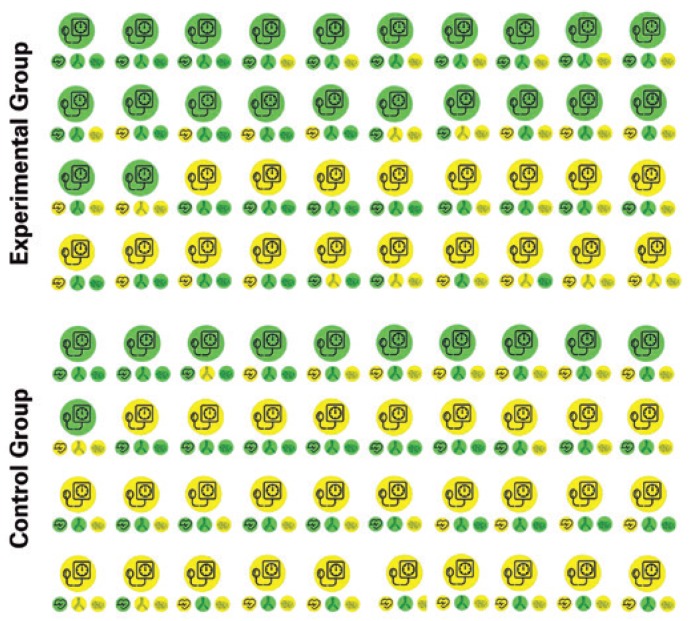
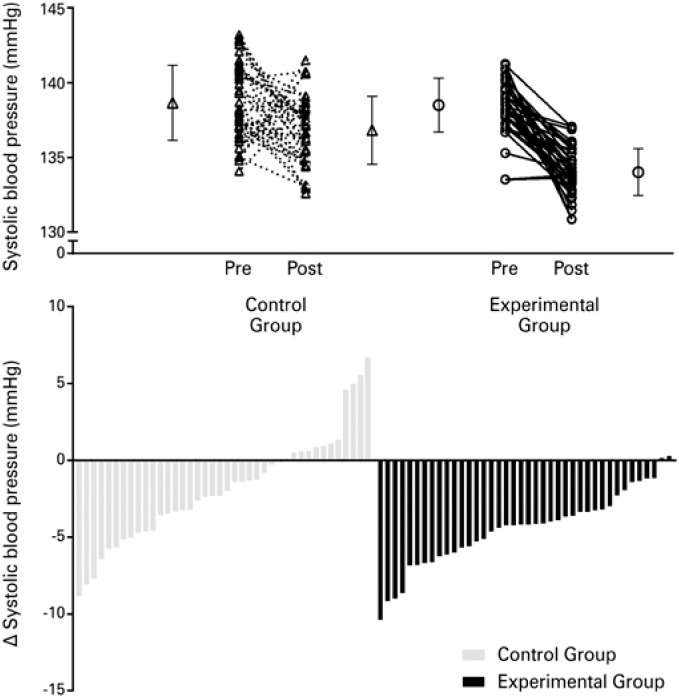
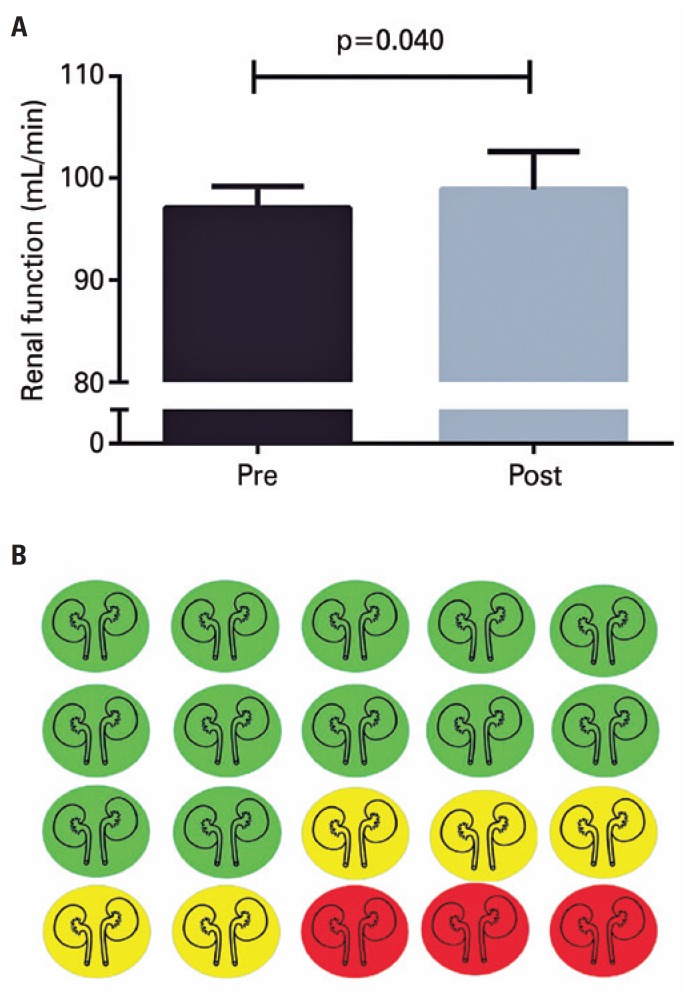
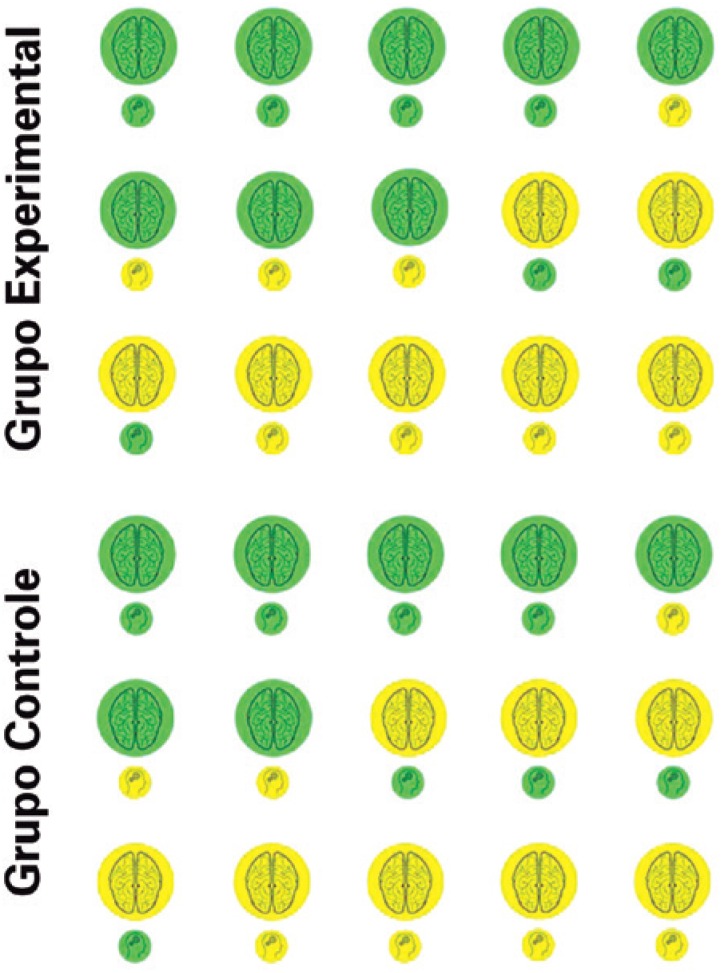
Randomized controlled trials are known to be the best tool to determine the effects of an intervention; however, most healthcare professionals are not able to adequately understand the results. In this report, concepts, applications, examples, and advantages of using visual data as a complementary tool in the results section of original articles are presented. Visual simplification of data presentation will improve general understanding of clinical research.
RESUMO: Ensaios clínicos randomizados são conhecidos por serem a melhor ferramenta para determinar os efeitos de uma intervenção. No entanto, a maioria dos profissionais de saúde não é capaz de compreender os resultados de forma adequada. Neste artigo, são apresentados conceitos, aplicações, exemplos e vantagens do uso de dados visuais como uma ferramenta complementar na seção dos resultados de artigos originais. A simplificação da visualização da apresentação dos dados deve melhorar o entendimento geral de pesquisas clínicas.
Conflict of interest statement
Figures


References
-
- Schulz KF, Altman DG, Moher D. Group C. CONSORT 2010 Statement: updated guidelines for reporting parallel group randomised trials. Trials. 2010;11:32–32. - PubMed
- 1. Schulz KF, Altman DG, Moher D, Group C. CONSORT 2010 Statement: updated guidelines for reporting parallel group randomised trials. Trials. 2010;11:32. - PMC - PubMed
-
- Johnston B, Alonso-Coello P, Friedrich J, Mustafa R, Tikkinen K, Neumann I, et al. Do clinicians understand the size of treatment effects? A randomized survey across 8 countries. CMAJ. 2016;188(1):25–32. - PMC - PubMed
- 2. Johnston B, Alonso-Coello P, Friedrich J, Mustafa R, Tikkinen K, Neumann I, et al. Do clinicians understand the size of treatment effects? A randomized survey across 8 countries. CMAJ. 2016;188(1):25-32. - PMC - PubMed
-
- Naggara O, Raymond J, Guilbert F, Roy D, Weill A, Altman DG. Analysis by categorizing or dichotomizing continuous variables is inadvisable: an example from the natural history of unruptured aneurysms. Am J Neuroradiol. 2011;32(3):437–440. - PMC - PubMed
- 3. Naggara O, Raymond J, Guilbert F, Roy D, Weill A, Altman DG. Analysis by categorizing or dichotomizing continuous variables is inadvisable: an example from the natural history of unruptured aneurysms. Am J Neuroradiol. 2011;32(3):437-40. - PMC - PubMed
-
- Ramalho M, Arboleda T, Hermelin D, Reznik G, Massarani L. A cobertura de ciência em telejornais do Brasil e da Colômbia: um estudo comparativo das construções midiáticas. Hist Cienc Saude Manguinhos. 2017;24(1):223–242. - PubMed
- 4. Ramalho M, Arboleda T, Hermelin D, Reznik G, Massarani L. A cobertura de ciência em telejornais do Brasil e da Colômbia: um estudo comparativo das construções midiáticas. Hist Cienc Saude Manguinhos. 2017;24(1):223-42. - PubMed
-
- Souza UJ, Camilo G, Carmo RC, Silva EV. O uso das redes sociais pelos periódicos brasileiros de biblioteconomia e ciência da informação. Rev ACB. 2015;20(3):584–591.
- 5. Souza UJ, Camilo G, Carmo RC, Silva EV. O uso das redes sociais pelos periódicos brasileiros de biblioteconomia e ciência da informação. Rev ACB. 2015;20(3):584-91.
MeSH terms
LinkOut - more resources
Full Text Sources
Medical
