. 2019 Nov 27;179(6):1255-1263.e12.
doi: 10.1016/j.cell.2019.11.009.

Conversion of Escherichia coli to Generate All Biomass Carbon from CO2

Affiliations

Conversion of Escherichia coli to Generate All Biomass Carbon from CO2

Shmuel Gleizer et al. Cell. .

Abstract

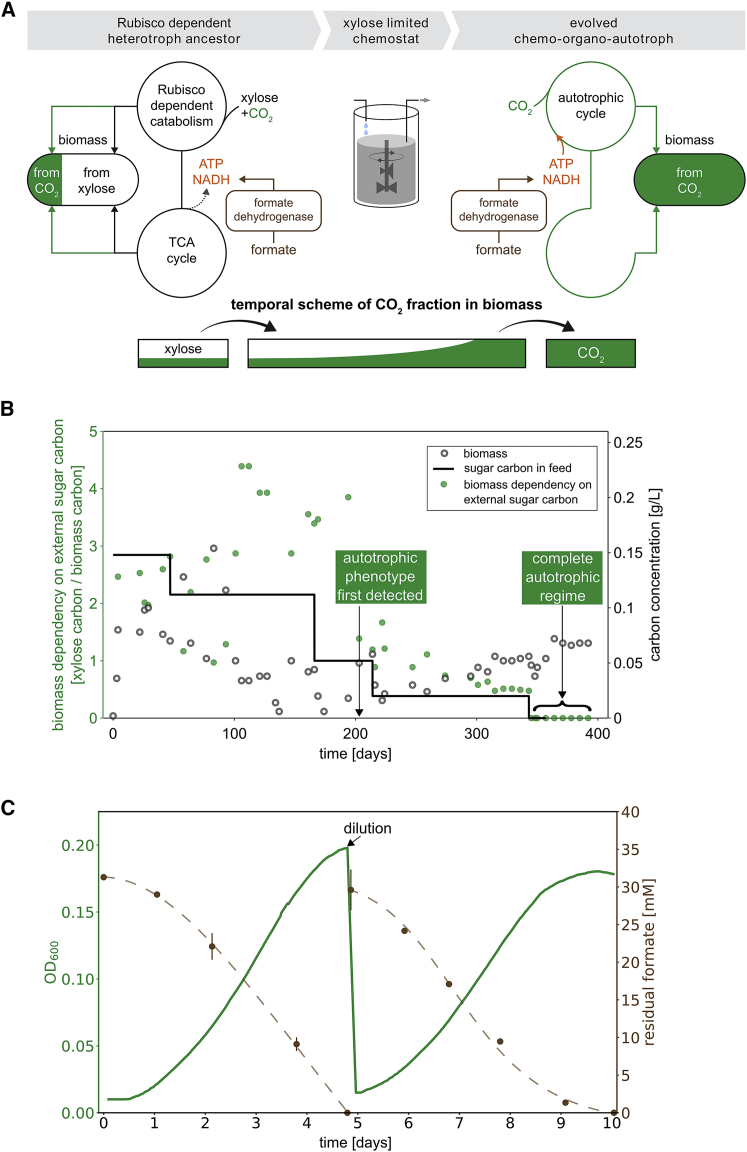
The living world is largely divided into autotrophs that convert CO2 into biomass and heterotrophs that consume organic compounds. In spite of widespread interest in renewable energy storage and more sustainable food production, the engineering of industrially relevant heterotrophic model organisms to use CO2 as their sole carbon source has so far remained an outstanding challenge. Here, we report the achievement of this transformation on laboratory timescales. We constructed and evolved Escherichia coli to produce all its biomass carbon from CO2. Reducing power and energy, but not carbon, are supplied via the one-carbon molecule formate, which can be produced electrochemically. Rubisco and phosphoribulokinase were co-expressed with formate dehydrogenase to enable CO2 fixation and reduction via the Calvin-Benson-Bassham cycle. Autotrophic growth was achieved following several months of continuous laboratory evolution in a chemostat under intensifying organic carbon limitation and confirmed via isotopic labeling.

Keywords: Escherichia coli; Rubisco; adaptive laboratory evolution; carbon fixation; metabolic rewiring; sustainability; synthetic autotrophy; synthetic biology.


Conflict of interest statement

We declare the following provisional patent related to the manuscript, “An Engineered Autotrophic E. coli Strain for CO2 Conversion to Organic Materials.”

Figures

None
Graphical abstract
Figure 1
Figure 1
Schematic Representation of the Engineered Synthetic Chemo-autotrophic E. coli CO2 (green) is the only carbon source for all the generated biomass. The fixation of CO2 occurs via an autotrophic carbon assimilation cycle. Formate is oxidized by a recombinant formate dehydrogenase (FDH) to produce CO2 (brown) and NADH. NADH provides the reducing power to drive carbon fixation and serves as the substrate for ATP generation via oxidative phosphorylation (OXPHOS in black). The formate oxidation arrow is thicker than the CO2 fixation arrow, thus indicating a net CO2 emission even under autotrophic conditions. See also Figure S1.
Figure S1
Figure S1
Flux Balance Analysis of the Autotrophic E. coli., Related to Figures 1 and 2 (A) Phenotypic phase plane showing the feasible space given the measured growth rate (0.04 ± 0.01 h-1) of the evolved strain (blue line). There is strong coupling between the formate uptake and the net CO2 production rate since formate can only be metabolised via FDH in our model. In reality, formate can be used for a relatively small flux of C1-related biosynthesis and these reactions are not part of the core model. However, at the measured growth rate, these fluxes are negligible compared to the FDH rate. The yellow shading indicates our measured value for the formate uptake rate (19 ± 2 mmol/gCDW/h). The blue cross indicates the flux balance analysis solution with the minimal total sum of fluxes (also known as pFBA). (B) Stacked bar plot showing the fluxes of all carboxylation and decarboxylation reactions, for the pFBA solution. FDH is by far the most significant decarboxylator, and rubisco is the major carboxylating reaction. (C) Same as B, except that we assume an alternative source for electrons which is CO2 neutral (note that the scale of the y axis is different). For example, if formate is produced electrochemically, its contribution to the net CO2 would cancel out. Legend abbreviations are as follows: FDH, formate dehydrogenase; PDH, pyruvate dehydrogenase; ICDHyr, isocitrate dehydrogenase; ME1, NAD+-dependent malate dehydrogenase; PPC, phosphoenolpyruvate carboxylase; RBC, rubisco.
Figure 2
Figure 2
Tailored Evolutionary Strategy from a Rationally Designed Engineered E. coli Strain toward an Evolved Chemo-autotroph (A) The parental strain for the evolution (left) harboring knockouts of the pfkAB and zwf genes, and overexpressing Rubisco, Prk, CA, and FDH, assimilates CO2 to enable xylose catabolism via the Rubisco-Prk shunt (see also Figure S2) but is unable to grow in autotrophic conditions. Upon xylose starvation in a xylose-limited chemostat with an excess of formate and CO2, the cells are under a strong selection pressure to use CO2 as the only carbon source, while using formate oxidation by FDH as the energy source. Evolved clones with a fully autotrophic phenotype (right) and a maximal growth rate in the absence of xylose higher than the dilution rate of the chemostat are predicted to have a fitness advantage over xylose-dependent clones and can take over the population. (B) The ancestral strain was inoculated into a xylose-limited chemostat with a dilution rate of 0.02 h−1. The concentration of the externally supplied sugar D-xylose in the feed media (black line) was decreased several times throughout the experiment. The biomass dependency on the externally supplied sugar (green dots) decreased starting at day 120, from a value of ≈15 xylose carbons/biomass carbon to zero following day 340 (≈250 chemostat generations). Starting from day 203 (≈150 chemostat generations) of the experiment and onward, we observed that samples taken from the chemostat could grow on minimal media supplemented only with formate and elevated CO2. For time points where the culture was not in steady chemostat mode (as described in the STAR Methods), the biomass dependency measure is not shown. (C) Repeated growth of the isolated evolved clone in liquid M9 minimal media with 30 mM sodium formate and sparged with a gas mixture of 10% CO2, 90% air. The doubling time of the evolved cells at the given conditions is 18 ± 4 h. Growth was carried out in DASGIP fermenters (150 mL working volume). Residual formate concentrations are represented by brown circles (n = 3, ± SD for values above 8 mM; n = 2, ± SD for values below 8 mM) (see also Figure S3).
Figure S2
Figure S2
Metabolic Configuration for Mixotrophic Rubisco-Dependent Growth, Related to Figure 2 (A) Metabolic depiction of native route of xylose metabolism in E. coli via the pentose phosphate pathway into glycolysis. (B) Knockout of the glycolytic phosphofructokinase (PfK) reaction and glucose-6-phosphate dehydrogenase (Zwf) reaction eliminate the possibility to shunt hexose-phosphates to any oxidative pathways and lead to their accumulation and arrest of growth. (C) Growth of the knockout strain could be rescued upon shunting excess pentose-phosphates via the carbon fixation branch (Prk + Rubisco) into glycolysis. (D) Computational prediction regarding the coupling between carboxylation flux through Rubisco (y axis) and growth (x axis) of the metabolic configuration depicted in (C). (Antonovsky et al., 2016) (E) experimental validation of the ΔpfkABΔzwf metabolic configuration: dependency on the expression of the carbon fixation branch is found only when xylose serves as the single organic carbon (n = 1 for each bar).
Figure S3
Figure S3
Growth Curve in Minimal Media with 35 mM Sodium Formate, Related to Figure 2 Repeated growth of the isolated evolved clone in liquid M9 minimal media with 35 mM sodium formate and sparging with a gas mixture of 10% CO2, 90% Air. The doubling time of the evolved cells at the given conditions is 18 ± 4 h. The residual concentrations of formate are shown in brown (n = 3, ± SD for values above 8 mM; n = 2, ± SD for values below 8 mM).
Figure 3
Figure 3
Isotopic Labeling Experiments Using 13C Show that All Biomass Components Are Generated from CO2 as the Sole Carbon Source (A) Values are based on LC-MS analysis of stable amino acids and sugar-phosphates (see STAR Methods). The fractional contribution of 13CO2 to various protein-bound amino acids and sugar-phosphates of evolved cells grown on 13CO2 and naturally labeled formate showed almost full 13C labeling of the biosynthesized amino acids. The numbers reported are the 13C fraction of each metabolite, taking into account the effective 13CO2 fraction out of the total inorganic carbon (which decreases due to unlabeled formate oxidation to CO2). The numbers in parentheses are the uncorrected measured values of the 13C fraction of the metabolites. Data are presented as mean ± SD; n = 5. (B) The average 13C fraction of nine analyzed amino acids of the evolved clone grown in different experimental setups. Experiments with 13CO2 as the substrate were carried in air-tight (i.e., “closed”) growth vessels. The bar with the parentheses represents the mean value after correction for the effective labeled fraction of CO2 in the experiment given the “pollution” with CO2 generated via formate oxidation and retention in the closed growth vessel. The value in the parentheses is the measured one, while the corrected value is shown without parentheses. As a positive control for maximal biomass 13C labeling, we grew wild-type E. coli in M9 minimal media supplemented with 13C6-glucose (far right). Error bars denote SD. See also Figure S4 and Tables S1, S2, and S3.
Figure S4
Figure S4
Amino Acid 13C Labeling Profile in Additional Labeling Experiments and the Effect of Unlabeled CO2 Emission from Formate Oxidation in Closed Vessels, Related to Figure 3 (A) The 13C fraction of various protein-bound amino acids and sugar-phosphates is close to 100% when the evolved cells were grown on 13CO2 and labeled 13C formate. The experiment was carried out in closed vessels (n = 3; ± SD). (B) The fractional contribution of 13C formate to various protein-bound amino acids and sugar-phosphates of evolved cells grown on 12CO2 and labeled 13C-formate showed minute 13C labeling of the sugar-phosphates and biosynthesized amino acids. The experiment was carried out in gas permeable vessels (n = 3; ± SD). (C) The weighted average of the effective isotopic composition of CO2 during a labeling experiment that starts with 99% 13CO2 (≈1 mmol) in the headspace and ≈0.3 mmol naturally labeled formate can be computed from the measured labeled fractions of glutamate and arginine, which we define as a 13CO2 “sensor.” The bottom box describes the calculation method and its implementation in the subsequent normalization of the raw labeling measurements of various metabolites (e.g., valine). (D) The experimental setup of isotopic biomass labeling with 13CO2 consists of a septum-sealed 250 mL growth flask and 10 mL of minimal M9 media with 30 mM naturally labeled sodium formate. In total, the vessel contains ≈0.3 mmol formate and ≈1 mmol of 13CO2 at the beginning of the experiment. The latter is flushed into the headspace via a thin needle, which is removed at the end of the flushing procedure. The initial inoculum of cells is also naturally labeled. As the cells grow and oxidize the formate to obtain energy, the isotopic composition of inorganic carbon within the vessel changes as depicted in the plot (blue line). The isotopic dynamics of the biomass carbon during autotrophic growth is depicted by the red line.
Figure 4
Figure 4
The Genetic Basis for Adaptation to Autotrophy The names of the mutated genes appear in red. The parentheses indicate the number of isolated clones in which the mutation appeared. As discussed in the main text, mutations observed across isolated clones can be divided into three broad groups. The first category includes mutations in genes with a direct metabolic link to the Calvin cycle, mostly flux branch points (the letter "p" at the end of the gene name denotes promoter region). The second category includes genes that are generic mutations common in other adaptive laboratory evolution experiments conducted with E. coli. The last category includes genes with uncharacterized role. Acronyms: E4P, erythrose-4-phosphate; P5P, pentose-5-phosphates; F6P, fructose-6-phosphate; 3PG, glycerate-3-phosphate. See also Table S4.

Comment in

References

    1. Aigner H., Wilson R.H., Bracher A., Calisse L., Bhat J.Y., Hartl F.U., Hayer-Hartl M. Plant RuBisCo assembly in E. coli with five chloroplast chaperones including BSD2. Science. 2017;358:1272–1278. - PubMed
    1. Antonovsky N., Gleizer S., Noor E., Zohar Y., Herz E., Barenholz U., Zelcbuch L., Amram S., Wides A., Tepper N. Sugar Synthesis from CO2 in Escherichia coli. Cell. 2016;166:115–125. - PMC - PubMed
    1. Baba T., Ara T., Hasegawa M., Takai Y., Okumura Y., Baba M., Datsenko K.A., Tomita M., Wanner B.L., Mori H. Construction of Escherichia coli K-12 in-frame, single-gene knockout mutants: the Keio collection. Mol. Syst. Biol. 2006;2:2006.0008. - PMC - PubMed
    1. Bar-On Y.M., Phillips R., Milo R. The biomass distribution on Earth. Proc. Natl. Acad. Sci. USA. 2018;115:6506–6511. - PMC - PubMed
    1. Barenholz U., Davidi D., Reznik E., Bar-On Y., Antonovsky N., Noor E., Milo R. Design principles of autocatalytic cycles constrain enzyme kinetics and force low substrate saturation at flux branch points. eLife. 2017;6:e20667. - PMC - PubMed