. 2019 Nov 27;179(6):1264-1275.e13.
doi: 10.1016/j.cell.2019.11.001.

TLR8 Is a Sensor of RNase T2 Degradation Products

Affiliations

TLR8 Is a Sensor of RNase T2 Degradation Products

Wilhelm Greulich et al. Cell. .

Abstract

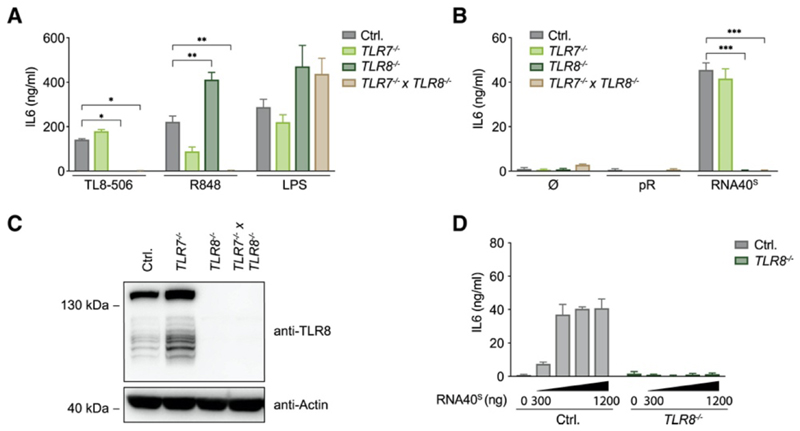
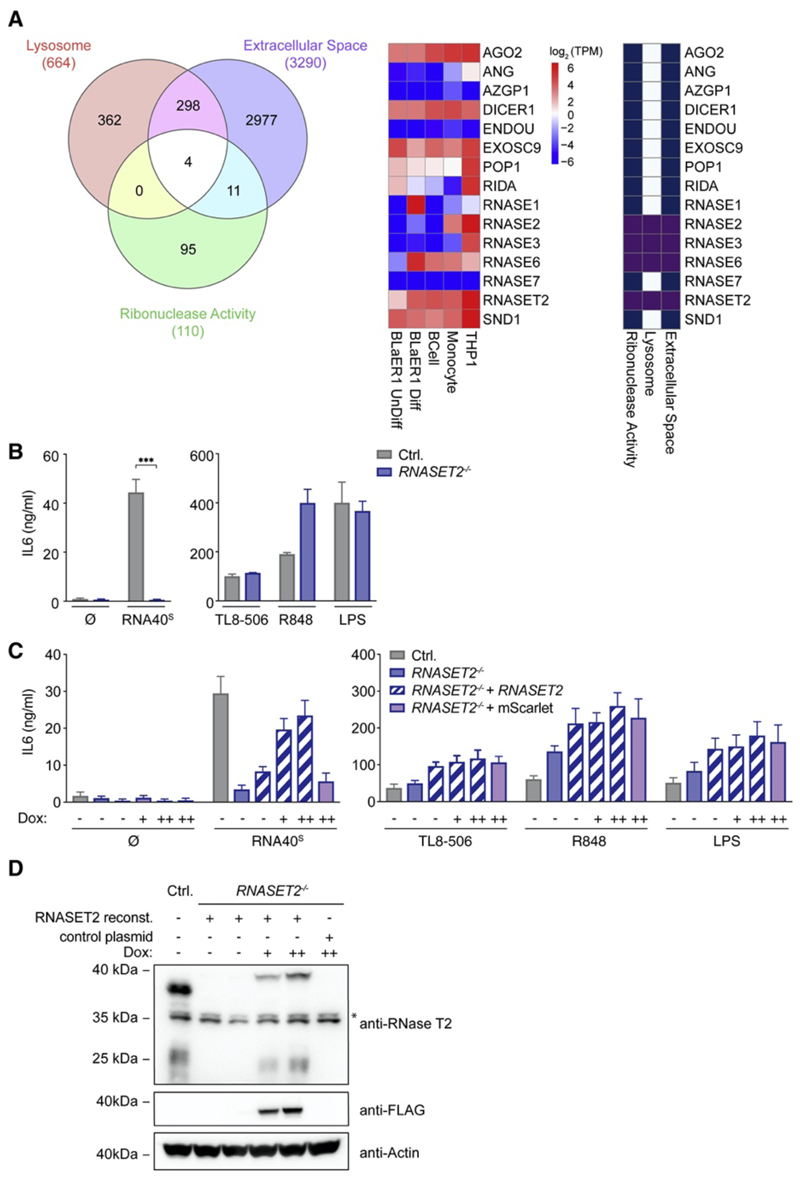
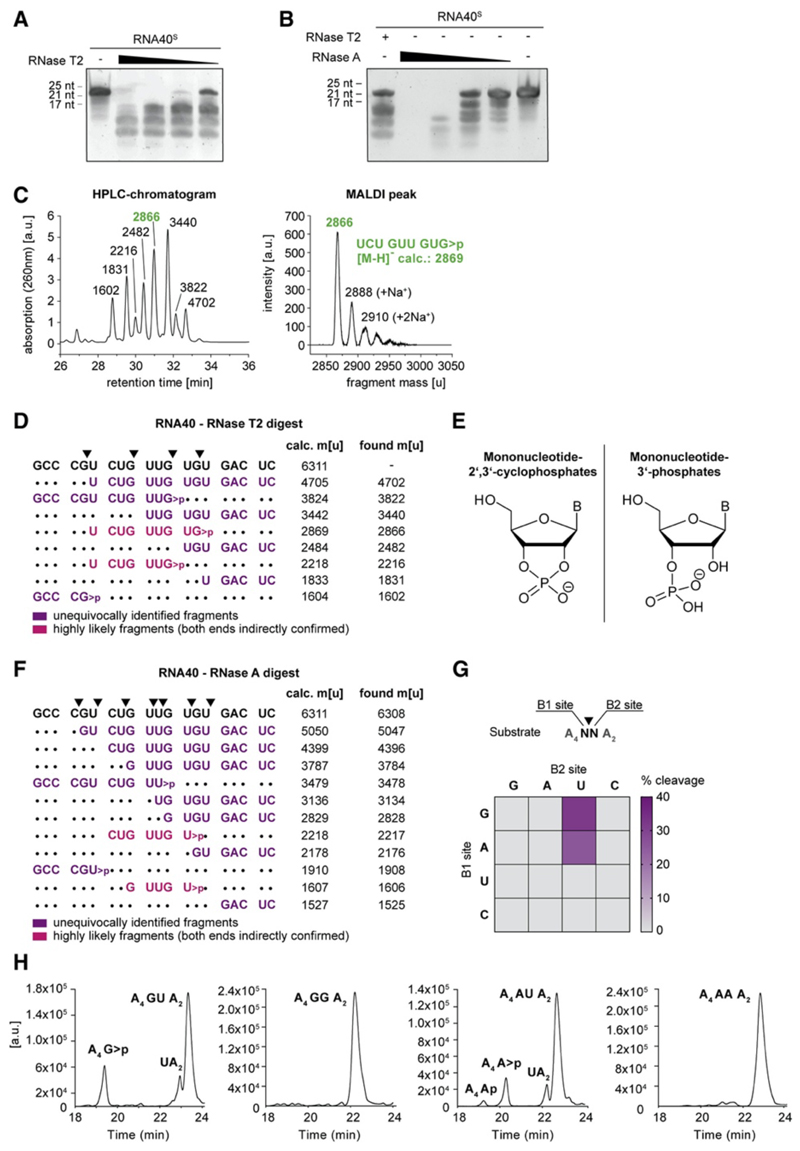
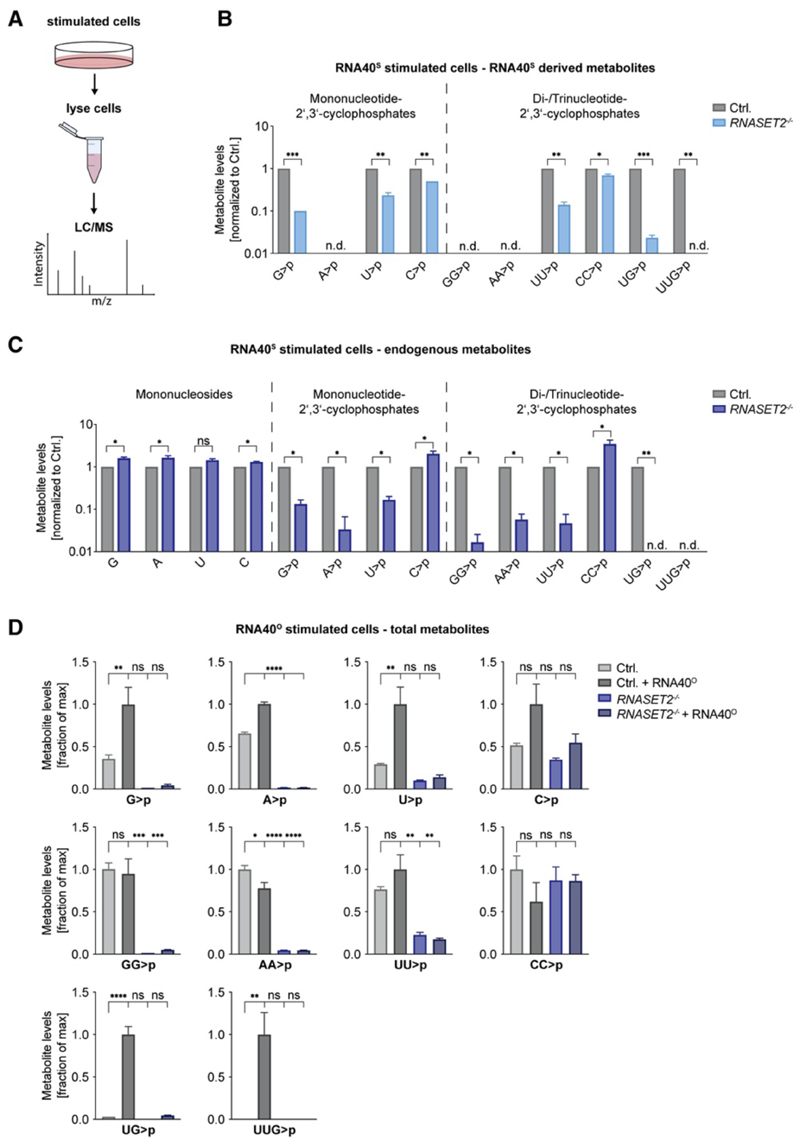
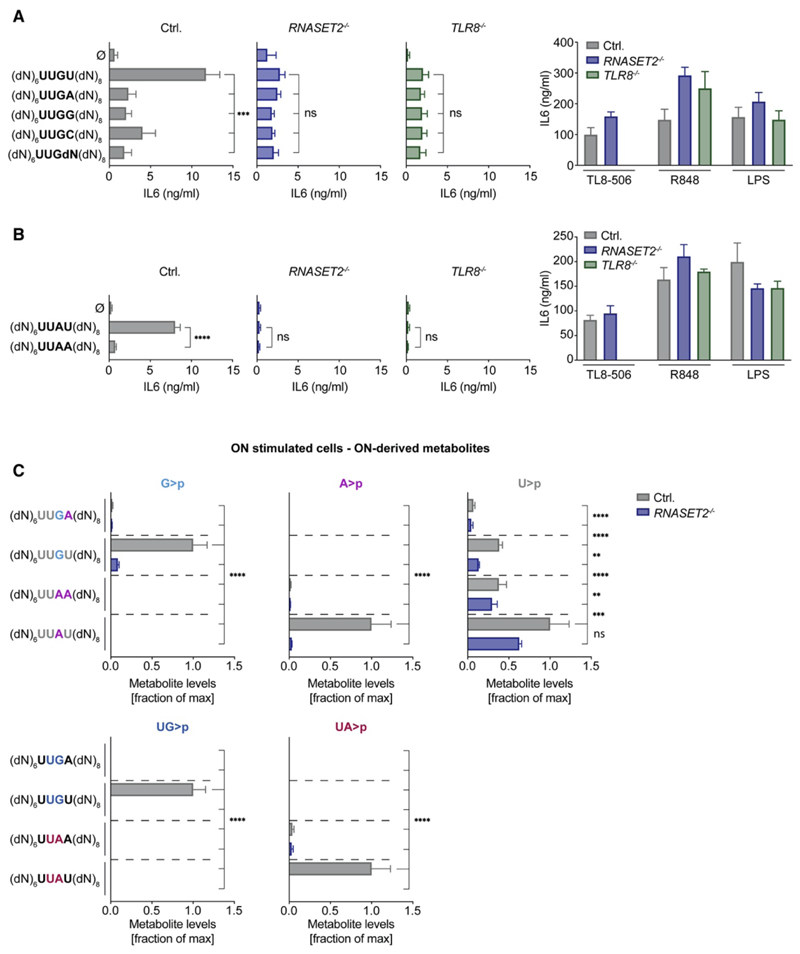
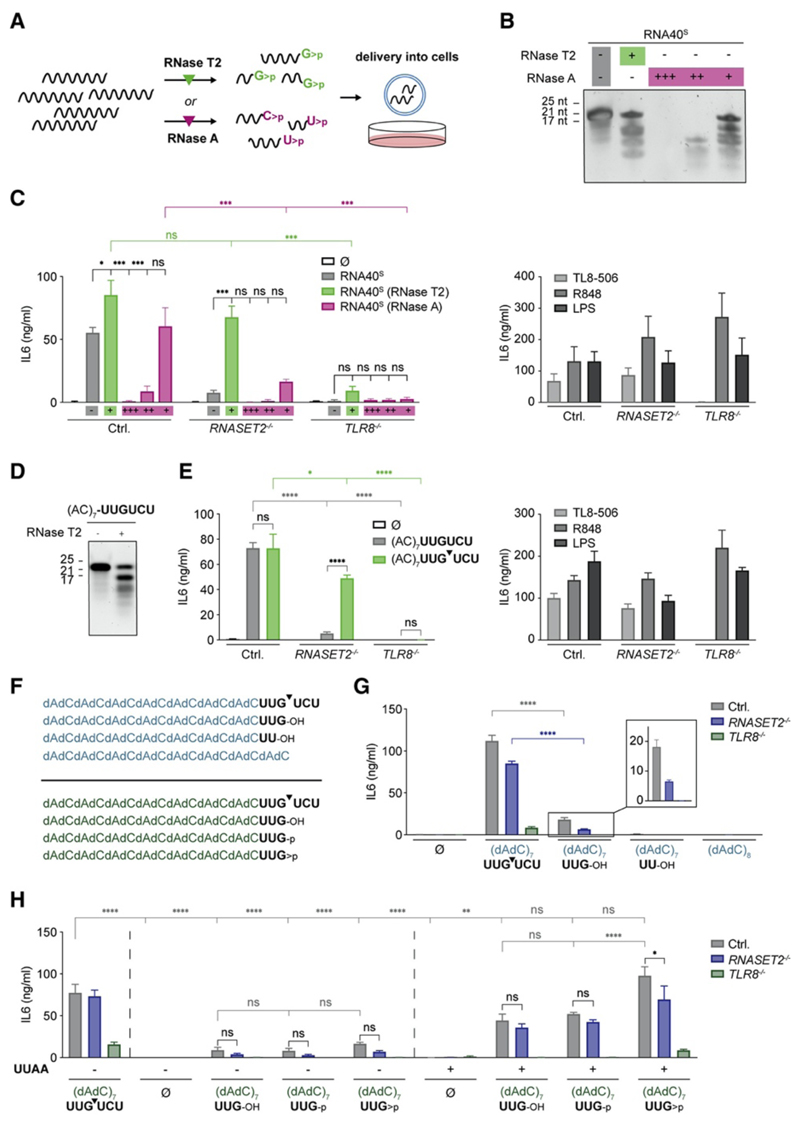
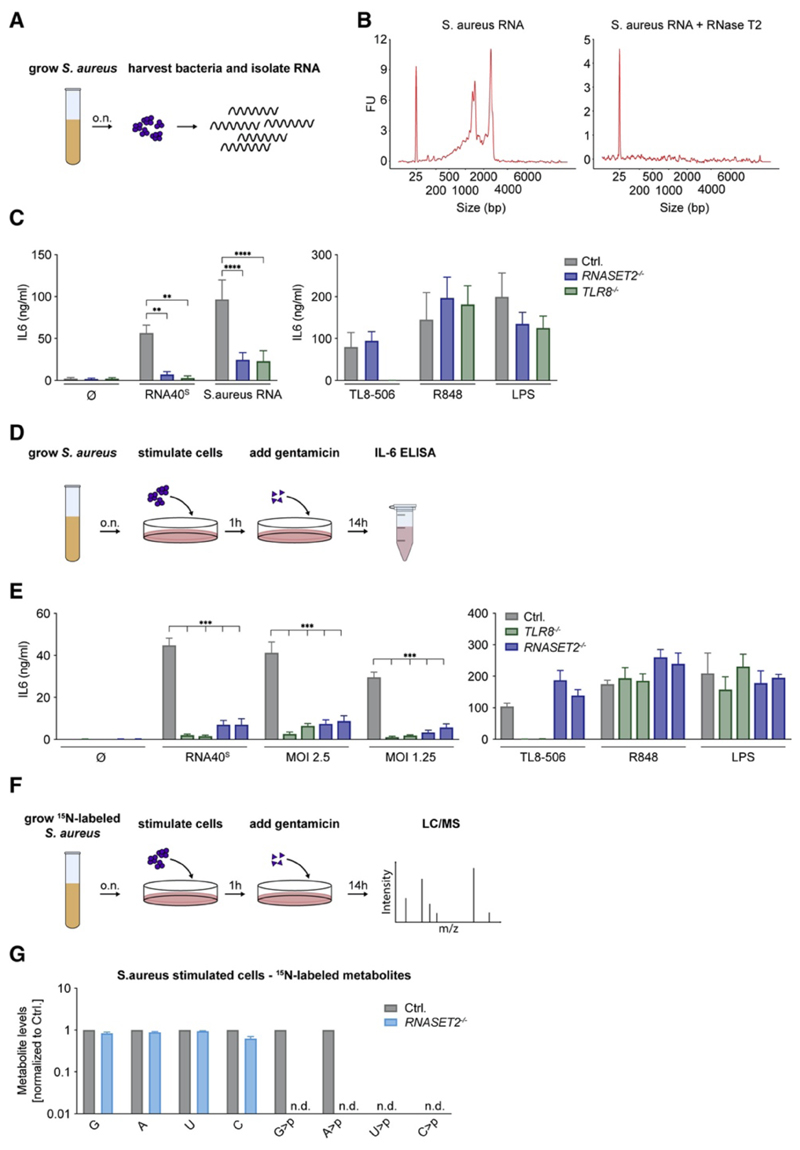
TLR8 is among the highest-expressed pattern-recognition receptors in the human myeloid compartment, yet its mode of action is poorly understood. TLR8 engages two distinct ligand binding sites to sense RNA degradation products, although it remains unclear how these ligands are formed in cellulo in the context of complex RNA molecule sensing. Here, we identified the lysosomal endoribonuclease RNase T2 as a non-redundant upstream component of TLR8-dependent RNA recognition. RNase T2 activity is required for rendering complex single-stranded, exogenous RNA molecules detectable for TLR8. This is due to RNase T2's preferential cleavage of single-stranded RNA molecules between purine and uridine residues, which critically contributes to the supply of catabolic uridine and the generation of purine-2',3'-cyclophosphate-terminated oligoribonucleotides. Thus-generated molecules constitute agonistic ligands for the first and second binding pocket of TLR8. Together, these results establish the identity and origin of the RNA-derived molecular pattern sensed by TLR8.

Keywords: RNA; RNase T2; TLR8; innate immunity; macrophage; monocyte; pattern recognition; toll-like receptor.


Conflict of interest statement

Declaration of Interests

The authors declare no competing interests

Figures

Figure 1
Figure 1. TLR7 and TLR8 Are Functional TLRs in BLaER1 Monocytes
(A and B) BLaER1 monocytes of indicated genotypes were stimulated with (A) TL8-506, R848, and LPS or were (B) unstimulated or stimulated with pR and RNA40S. After 14 h, IL-6 release was measured. (C) TLR8 expression in BLaER1 cells of indicated genotypes. (D) Control and TLR8-deficient BLaER1 monocytes were stimulated with increasing amounts of RNA40S. After 14 h, IL-6 was measured. Data are depicted as mean + SEM of three independent experiments (A, B, and D) or one of three representative blots (C). Statistics indicate significance by two-way ANOVA: ***p ≤ 0.001; **p ≤ 0.01; *p ≤ 0.05; ns, not significant. See also Figure S1.
Figure 2
Figure 2. RNase-T2-Deficient Cells Fail to Respond to RNA Oligonucleotides
(A) Venn diagram of proteins that are, according to their Gene Ontology (GO) terms, annotated as “lysosomal,” “extracellular space,” or “ribonuclease activity” (left). A heatmap shows RNA expression levels of several RNases and their GO-term designation in the indicated cell types (middle and right). (B) IL-6 production in BLaER1 Controls and RNASET2 −/− cells stimulated with RNA40S, TL8-506, R848, and LPS for 14 h. (C) RNASET2 −/− cells were reconstituted with doxycycline-inducible RNase T2 (++, 1 μg/mL; +, 0.5 μg/mL). An inducible mScarlet construct was used as a control. (D) The immunoblot corresponding to the reconstitution experiment is shown. The asterisk indicates unspecific bands. Data are depicted as mean + SEM of three independent experiments or one of three representative blots. Statistics indicate significance by two-way ANOVA: ***p ≤ 0.001; **p ≤ 0.01; *p ≤ 0.05; ns, not significant. See also Figure S2.
Figure 3
Figure 3. RNase T2 Cleaves RNA between Purine Bases and Uridine
(A and B) Urea gel of RNA40S digested with decreasing RNase T2 (A) or RNase A (B) concentrations. One representative gel of two independent experiments is shown. (C) HPLC chromatogram of RNA40O-derived ON fragments (left; fragment masses determined by MALDI-TOF) and the corresponding MALDI peak of one representative peak (right) (D) RNA40O was digested with RNase T2 and analyzed by HPLC and MALDI-TOF. The most likely assigned fragments based on MALDI-TOF analysis are depicted next to all calculated and found masses. Calculated masses are shown as [M-H]. (E) Structure of mononucleotide 2ʹ,3ʹ-cyclophosphates (left) and Mononucleotide 3ʹ-phosphates (right) (F) RNA40O was digested in vitro with RNase A and analyzed as above. Masses are shown as [M-H]. (G) 16 ONs containing all possible dinucleotide combinations (A4NNA2) were analyzed after RNase T2 in vitro digestion. Of note, all ONs with a U at the B1 site were also cut between A and U, whereas cleavage between U and N was not detected. (H) HPLC chromatograms corresponding to the in vitro digests of GU, GG, AU, and AA (G). See also Figure S3.
Figure 4
Figure 4. RNase T2 Deficiency Leads to Altered RNA Metabolism
(A) BLaER1 cells were stimulated with RNA40S for 14 h, and then lysates were analyzed by liquid chromatography-mass spectrometry (LC-MS). (B and C) Cell lysates of RNA40S stimulated BLaER1 cells with indicated genotypes were analyzed by LC-MS. RNA40S-derived (B) or endogenous (C) metabolites are shown. Data are normalized to control cells (note logarithmic scale). (D) Cell lysates of RNA40O-stimulated BLaER1 cells with indicated genotypes were analyzed by LC-MS. For each metabolite dataset, the mean of the maximal values was determined, and all data are depicted as a fraction thereof. Data are depicted as mean + SEM of three independent experiments. Statistics indicate significance by a Welch’s unequal variances t test (B and C) or by one-way ANOVA (D). ****p ≤ 0.0001; ***p ≤ 0.001; **p ≤ 0.01; *p ≤ 0.05; ns, not significant; n.d., not detected. See also Figure S4.
Figure 5
Figure 5. A Minimal Motif for TLR8
(A and B) BLaER1 cells were stimulated with the indicated DNA-RNA UUG-containing (A) or UUA-containing (B) hybrid ONs or control stimuli. The four bases in the middle are ribonucleotides flanked by random deoxynucleotides (dN). IL-6 was measured after 14 h. (C) BLaER1 cells were stimulated with the indicated DNA-RNA hybrid ONs and analyzed by LC-MS (14 h after stimulation). For all stimulations, 2.4 μg of the respective ON was used. For each metabolite dataset, the mean of the maximal values was determined, and all data are depicted as a fraction thereof. Data are depicted as mean + SEM of three independent experiments. Statistics indicate significance by two-way (A and B) or one-way ANOVA (C): ****p ≤ 0.0001; ***p ≤ 0.001; **p ≤ 0.01; *p ≤ 0.05; ns, not significant. See also Figure S5.
Figure 6
Figure 6. RNase T2 Degradation Products Bypass the Lack of RNase T2 to Exert TLR8 Agonism
(A) RNA40 was digested with either RNase T2 or RNase A, and BLaER1 cells were transfected with thus-obtained degradation products. (B) Urea gel of RNA40S digested with RNase T2 or different concentrations of RNase A. (C) Digested RNA40S from (B) or respective controls were used to stimulate BLaER1 cells. (D) Urea gel of full-length and RNase-T2-digested (AC)7-UUGUCU. (E) BLaER1 cells were stimulated with either digested or undigested (AC)7-UUGUCU and the indicated controls. (F) List of ONs used for the stimulations in (G) (top) and (H) (bottom). Arrow indicates in vitro digestion with RNase T2. (G) ONs depicted in (F) were used to stimulate BLaER1 cells. Control stimuli are shown in Figure S6D. (H) The ONs depicted in (F) were purified by HPLC and then used to stimulate BLaER1 cells. To obtain the (dAdC)7UUG>p cyclophosphate, we digested (dAdC)7-UUGUCU ON by RNase T2 and purified by HPLC. Control stimuli are shown in Figure S6F. In the right panel, all ONs were co-transfected with the DNA-RNA hybrid (dN)6UUAA(dN)8 (1.2 μg), serving as an uridine donor. IL-6 was measured after 14 h. Data are depicted as mean + SEM of three independent experiments or one of three representative gels. Statistics indicate significance by two-way ANOVA: ****p ≤ 0.0001; ***p ≤ 0.001; **p ≤ 0.01; *p ≤ 0.05; ns, not significant. See also Figure S6.
Figure 7
Figure 7. S. aureus Detection in Myeloid Cells Depends on RNase T2 Upstream of TLR8
(A) RNA was isolated from S. aureus to stimulate BLaER1 cells. (B) Bioanalyzer spectrum of undigested or RNase-T2-digested S. aureus RNA. (C) BLaER1 cells stimulated with S. aureus RNA and indicated controls. (D) Schematic view of how live S. aureus was used to stimulate BLaER1 cells at different MOIs. (E) After infection or stimulation with indicated controls, IL-6 was measured. (F) Schematic view of how S. aureus was grown in 15N-labeled medium and used to stimulate BLaER1 cells. (G) S. aureus-derived metabolites were analyzed by LC-MS after infection. Data are normalized to control cells (note logarithmic scale). Data are depicted as mean + SEM of two (G), three (E), or four (C) independent experiments. Statistics indicate significance by two-way ANOVA: ****p ≤ 0.0001; ***p ≤ 0.001; **p ≤ 0.01; *p ≤ 0.05; ns, not significant; n.d., not detected. See also Figure S7.

References

    1. Ablasser A, Poeck H, Anz D, Berger M, Schlee M, Kim S, Bourquin C, Goutagny N, Jiang Z, Fitzgerald KA, et al. Selection of molecular structure and delivery of RNA oligonucleotides to activate TLR7 versus TLR8 and to induce high amounts of IL-12p70 in primary human monocytes. J Immunol. 2009;182:6824–6833. - PubMed
    1. Ahn J, Gutman D, Saijo S, Barber GN. STING manifests self DNA-dependent inflammatory disease. Proc Natl Acad Sci U S A. 2012;109:19386–19391. - PMC - PubMed
    1. Barbalat R, Ewald SE, Mouchess ML, Barton GM. Nucleic acid recognition by the innate immune system. Annu Rev Immunol. 2011;29:185–214. - PubMed
    1. Bergstrom B, Aune MH, Awuh JA, Kojen JF, Blix KJ, Ryan L, Flo TH, Mollnes TE, Espevik T, Stenvik J. TLR8 Senses Staphylococcus aureus RNA in Human Primary Monocytes and Macrophages and Induces IFN-beta Production via a TAK1-IKKbeta-IRF5 Signaling Pathway. J Immunol. 2015;195:1100–1111. - PubMed
    1. Chan MP, Onji M, Fukui R, Kawane K, Shibata T, Saitoh S, Ohto U, Shimizu T, Barber GN, Miyake K. DNase II-dependent DNA digestion is required for DNA sensing by TLR9. Nat Commun. 2015;6 5853. - PubMed

Publication types

MeSH terms