. 2019 Nov 27;179(6):1276-1288.e14.
doi: 10.1016/j.cell.2019.10.034.

GPR146 Deficiency Protects against Hypercholesterolemia and Atherosclerosis

Affiliations

GPR146 Deficiency Protects against Hypercholesterolemia and Atherosclerosis

Haojie Yu et al. Cell. .

Abstract

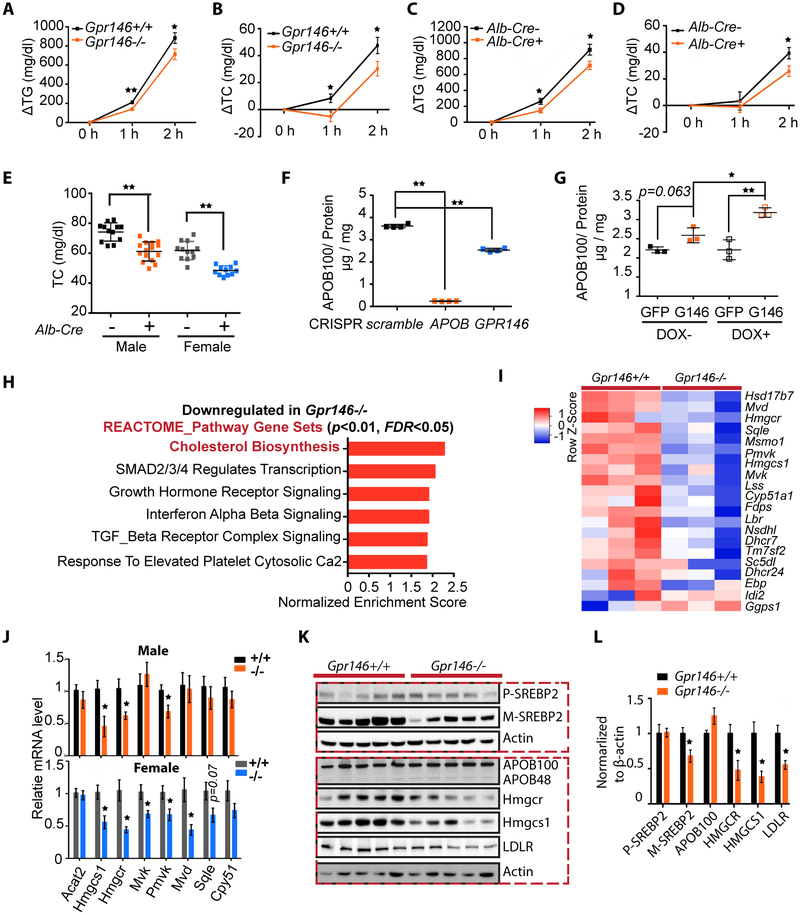
Although human genetic studies have implicated many susceptible genes associated with plasma lipid levels, their physiological and molecular functions are not fully characterized. Here we demonstrate that orphan G protein-coupled receptor 146 (GPR146) promotes activity of hepatic sterol regulatory element binding protein 2 (SREBP2) through activation of the extracellular signal-regulated kinase (ERK) signaling pathway, thereby regulating hepatic very low-density lipoprotein (VLDL) secretion, and subsequently circulating low-density lipoprotein cholesterol (LDL-C) and triglycerides (TG) levels. Remarkably, GPR146 deficiency reduces plasma cholesterol levels substantially in both wild-type and LDL receptor (LDLR)-deficient mice. Finally, aortic atherosclerotic lesions are reduced by 90% and 70%, respectively, in male and female LDLR-deficient mice upon GPR146 depletion. Taken together, these findings outline a regulatory role for the GPR146/ERK axis in systemic cholesterol metabolism and suggest that GPR146 inhibition could be an effective strategy to reduce plasma cholesterol levels and atherosclerosis.

Keywords: ERK1/2; SREBP2 pathway; atherosclerosis; hypercholesterolemia; orphan G protein-coupled receptor 146.


Conflict of interest statement

DECLARATION OF INTERESTS

C.A.C. is a founder of CRISPR Therapeutics and Sana Biotechnology. S.K. is a founder of Maze Therapeutics, Verve Therapeutics, and San Therapeutics.

Figures

Figure 1.
Figure 1.. GPR146 Regulates Plasma Cholesterol Levels in both Human and Mouse
(A) Reginal (7p22 locus) association of GWAS variants with plasma cholesterol levels shows that common SNP rs1997243 (purple diamond) and GPR146 p.Gly11Glu (red circle) are significantly associated with plasma TC levels in humans. (B) eQTL studies using 2,116 human blood samples revealed a highly significant dose-dependent relation between the rs1997243 G-allele and GPR146 expression (n=1428 for A/A, n=627 for A/G and n=61 for G/G). (C) Schematic diagram showing generation of Gpr146 whole-body knockout (Gpr146−/−) and floxed mouse models (Gpr146fl/fl) using CRISPR/Cas9 system. (D) Gpr146 mRNA levels in epididymal white adipose tissue (eWAT), inguinal white adipose tissue (ingWAT), interscapular brown adipose tissue (iBAT), liver, skeletal muscle tibialis anterior (TA), quadriceps (Quad), heart, kidney and intestine, of 8-weeks old Gpr146 wild type (+/+) and knockout (−/−) male mice (n=3 mice per group). (E and H) Plasma total cholesterol (TC) levels of 16-hour fasted male (E) and female (H) Gpr146 wild-type (+/+) mice and knockout (−/−) littermates fed chow at different ages indicated (n= 13–18 mice per group, by Student’s t-test). (F and I) Pooled plasma from male (F) and female (I) mice was subjected to Fast Protein Liquid Chromatography (FPLC) analysis, and cholesterol was measured in each of the eluted fractions (pooled samples of n=13–18 mice per group). (G and J) Area under curve (AUC) was used to calculate the levels of VLDL-C (fractions 7 to 13), IDL/LDL-C (fraction 13 to 29) and HDL-C (fraction 29 to 49) in FPLC plots (F and I). * p< 0.05, ** p< 0.01; bars in E and H indicate mean ± s.d.; bars in D indicate mean± s.e.m.
Figure 2.
Figure 2.. GPR146 Deficiency Reduces Hepatic SREBP2 Activities and VLDL Secretion Rate
(A-D) Changes of plasma TG (A and C) and TC (B and D) after Poloxamer-407 injection in Gpr146 whole body knockout mice (Gpr146+/+ vs Gpr146−/−, n=12–14 mice per group, by Student’s t-test) and liver-specific knockout mice (Alb-Cre- vs Alb-Cre+, n=8 mice per group, by Student’s t-test) fed chow. (E) Plasma TC levels of 16-hour fasted male and female Gpr146 liver-specific knockout (Alb-Cre+) and control littermates (Alb-Cre-) fed chow (n= 11–15 mice per group, by Student’s t-test). (F) Depletion of GPR146 via CRISPR/Cas9 leads to reduced APOB100 secretion in Huh7 human hepatoma cells (n=4 replicates per genotype per experiment, representative of 3 independent experiments, by Student’s t-test). (G) Recombinantly overexpressed GPR146, compared with GFP control, results in increased APOB100 secretion (n=3 replicates per genotype per experiment, representative of 2 independent experiments, by one-way ANOVA). (H) Top ranking REACTOME pathway gene sets discovered from gene set enrichment analysis (GSEA) of genes that are differentially expressed in liver of male Gpr146+/+ mice and Gpr146−/− littermates (n=3 mice per group) upon 6-hour refeeding after a 16-hour fast. (I) Heat map of cholesterol biosynthesis (REACTOME Pathway Database)-related genes in livers of male Gpr146+/+ and Gpr146−/− mice (n=3 mice per group). (J) Quantitative polymerase chain reaction (qPCR) expression analysis of cholesterol biosynthetic genes in liver of 6-hour refed male and female Gpr146+/+ mice and Gpr146−/− littermates (n=5 mice per group, by Student’s t-test). (K and L) Western blot (K) and relative quantification (L) of SREBP2 precursor (P-SREBP2), mature SREBP2 (M-SREBP2), APOB100, HMGCR, HMGCS1 and LDLR in liver of 6-hour refed male Gpr146+/+ mice and Gpr146−/− littermates (n=5 mice per group, by Student’s t-test). * p< 0.05, ** p< 0.01; bars in A-D, J and L indicate mean± s.e.m., bars in E-G indicate mean ± s.d..
Figure 3.
Figure 3.. GPR146 Promotes ERK1/2 Activities in Hepatocytes Upon Feeding
(A) GSEA enrichment plot of MAPK_Signaling gene set (KEGG pathway database) in liver of Gpr146+/+ mice and Gpr146−/− littermates (n=3 mice per group) upon 6-hour refeeding after a 16-hour fast. (B and C) Western blot (B) and relative quantification (C) of phosphorylated ERK1/2 (pERK1/2) and total ERK1/2 in liver of 6-hour refed Gpr146+/+ mice and Gpr146−/− littermates (n=5 mice per group, by Student’s t-test). (D and E) Western blot (D) and relative quantification (E) of phosphorylated ERK1/2 (pERK1/2) and total ERK1/2 in liver of 16-hour fasted Gpr146+/+ mice and Gpr146−/− littermates (n=7 mice per group, by Student’s t-test). (F) Western blot of phosphorylated ERK1/2 (pERK1/2) and total ERK1/2 in liver of 16-hour fasted male mice (C57BL/6J) or 6-hour refed littermates upon chow diet feeding (n=4 mice per group). (G and H) Western blot (G) and relative quantification (H) showing upregulated pERK1/2 levels with recombinant expression of human GPR146 in HepG2 cells upon stimulation with serum for the time indicated (n=2 replicates per genotype per experiment, representative of 3 independent experiments, by Student’s t-test). * p< 0.05, ** p< 0.01; bars in C indicate mean± s.e.m., bars in E and H indicate mean ± s.d..
Figure 4.
Figure 4.. GPR146 Regulates SREBP2 Signaling Pathway and Plasma TC levels through ERK1/2 upon Feeding
(A-C) Fold induction of SREBP2 (A), HMGCR (B) and LDLR (C) mRNA levels in human hepatoma HepG2 cells upon serum stimulation in the presence or absence of MEK inhibitor PD0325901 (PD) (n=3 replicates per time point per experiment, representative of 3 independent experiments, by Student’s t-test). (D) Western blot of mature SREBP2 in HepG2 cells upon serum stimulation in the presence or absence of PD0325901. (E) Western blot showing CRISPR-induced depletion of ERK1, ERK2 or ERK1/2 in HepG2 cells in the presence or absence of serum stimulation. (F-H) Fold induction of SREBP2 (F), HMGCR (G) and LDLR (H) mRNA levels in HepG2 cells lacking ERK1, ERK2 or ERK1/2 (n=3 replicates per genotype per experiment, representative of 3 independent experiments, by one-way ANOVA). (I) Fold induction of HMGCR and LDLR mRNA level in HepG2 cells with recombinant expression of GPR146 or GFP (n=3 replicates per genotype per experiment, representative of 3 independent experiments, by Student’s t-test). (J) Schedule of MEK inhibitor PD0325901 treatment in vivo. (K and L) Plasma TC levels (K) and relative mRNA levels of hepatic Hmgcr, Ldlr and Srebp2 (L) in chow-fed female Gpr146+/+ mice and Gpr146−/− littermates upon 6-hour refeeding after a 16-hour fast, treated with vehicle or PD0325901 (5mg/kg Body Weight) for the period of time indicated (n=5 mice per group, by one-way ANOVA). * p< 0.05, ** p< 0.01; bars in this figure indicate mean± s.d..
Figure 5.
Figure 5.. GPR146 Regulates ERK/SREBP2 Axis in Mice upon Short Period of Fasting
(A) Schedule of fasting and refeeding treatment in vivo. (B and C) Western blot (B) and relative quantification (C) of phosphorylated ERK1/2 (pERK1/2) and total ERK1/2 in livers of mice upon different fasting refeeding regimens (n=3 mice per group, by one-way ANOVA). (D and E) Western blot (D) and relative quantification (E) of SREBP2 precursor (P-SREBP2), mature SREBP2 (M-SREBP2), pERK1/2 and total ERK1/2 in livers of 6-hour fasted Gpr146+/+ mice and Gpr146−/− littermates (n=5 mice per group, by Student’s t-test). (F) Quantitative polymerase chain reaction (qPCR) expression analysis of cholesterol biosynthetic genes in liver of 6-hour fasted Gpr146+/+ mice and Gpr146−/− littermates (n=5 mice per group, by Student’s t-test). * p< 0.05, ** p< 0.01; bars in C and E indicate mean± s.d., bars in F indicate mean± s.e.m..
Figure 6.
Figure 6.. GPR146 Deficiency Protects Against Hypercholesterolemia and Atherosclerosis in LDLR-deficient Mice
(A and C) Plasma TC levels of Gpr146 whole-body knockout male (A) and female (C) mice lacking LDLR fed chow or western diet (WD) for 16 weeks (n=6–10 mice per group, by one-way ANOVA). (B and D) HDL and VLDL/LDL fractions in plasma of Gpr146 whole-body knockout male (B) and female (D) mice lacking LDLR were separated, and cholesterol levels were measured in both fractions (n=6–10 mice per group, by one-way ANOVA). (E) Representative images of plasma (top layer) isolated from Gpr146+/+ and Gpr146−/− male mice lacking LDLR fed WD for 16 weeks. (F and G) Western blot (F) and relative quantification (G) of SREBP2 precursor (P-SREBP2), mature SREBP2 (M-SREBP2), pERK1/2 and total ERK1/2 in livers of 6-hour refed male Gpr146+/+ mice and Gpr146−/− littermates lacking LDLR upon chow feeding (n=6 mice per group, by Student’s t-test). (H) Quantitative polymerase chain reaction (qPCR) expression analysis of cholesterol biosynthetic genes in liver of 6-hour refed male and female Gpr146+/+ mice and Gpr146−/− littermates lacking LDLR upon chow feeding (n=6–7 mice per group, by Student’s t-test). (I and L) Representative images of aortas before and after Oil Red O staining in Gpr146 wild type and whole-body knockout male (I) and female (L) mice lacking LDLR fed WD for 16 weeks. (J and M) Quantification of aortic lesion areas (expressed as a percentage of the lumen area in full-length aorta) in male (J) and female (M) mice (n=6–10 mice per group, by Student’s t-test). (K and N) Scatter plot of plasma total cholesterol levels and aortic lesion areas in male (K) and female mice (N) lacking LDLR. * p< 0.05, ** p< 0.01; bars in A-D, G, J and M indicate mean± s.d., bars in H indicate mean± s.e.m..
Figure 7.
Figure 7.. Knockdown of GPR146 by AAV-delivered shRNA Lowers Plasma Cholesterol Levels in Mice Lacking LDLR
(A) Schedule of AAV-mediated knockdown of GPR146 in mice lacking LDLR. (B and C) Plasma TC levels of male (B) and female (C) mice lacking LDLR before and after injection of AAV8-scramble control or AAV8-Gpr146-shRNA viruses (n=5–6 mice per group, by Student’s t-test). (D) HDL and VLDL/LDL fractions in plasma of LDLR-deficient mice 6-weeks post AAV injection were separated, and cholesterol levels were measured in both fractions (n=5–6 mice per group, by Student’s t-test). (E) qPCR expression analysis of cholesterol biosynthetic genes in liver of 6-hour refed male LDLR-deficient mice 6-weeks post AAV injection (n=5–6 mice per group, by Student’s t-test). (F) Model of the pathway by which depletion of hepatic GPR146 protects against hypercholesterolemia and atherosclerosis. * p< 0.05, ** p< 0.01; bars in B-D indicate mean± s.d., bars in E indicate mean± s.e.m..

Comment in

References

    1. Addis RC, Hsu FC, Wright RL, Dichter MA, Coulter DA, and Gearhart JD (2011). Efficient conversion of astrocytes to functional midbrain dopaminergic neurons using a single polycistronic vector. PLoS One 6, e28719. - PMC - PubMed
    1. Adiels M, Olofsson SO, Taskinen MR, and Boren J (2008). Overproduction of very low-density lipoproteins is the hallmark of the dyslipidemia in the metabolic syndrome. Arterioscler Thromb Vasc Biol 28, 1225–1236. - PubMed
    1. Ai M, Otokozawa S, Asztalos BF, Ito Y, Nakajima K, White CC, Cupples LA, Wilson PW, and Schaefer EJ (2010). Small dense LDL cholesterol and coronary heart disease: results from the Framingham Offspring Study. Clin Chem 56, 967–976. - PMC - PubMed
    1. Arito M, Horiba T, Hachimura S, Inoue J, and Sato R (2008). Growth factor-induced phosphorylation of sterol regulatory element-binding proteins inhibits sumoylation, thereby stimulating the expression of their target genes, low density lipoprotein uptake, and lipid synthesis. J Biol Chem 283, 15224–15231. - PMC - PubMed
    1. Barrows BR, and Parks EJ (2006). Contributions of different fatty acid sources to very low-density lipoprotein-triacylglycerol in the fasted and fed states. J Clin Endocrinol Metab 91, 1446–1452. - PubMed

Publication types

MeSH terms