Comparative Study
. 2020 Jan:122:108723.
doi: 10.1016/j.ejrad.2019.108723. Epub 2019 Oct 25.

Automated measurement of liver attenuation to identify moderate-to-severe hepatic steatosis from chest CT scans

Affiliations
Comparative Study

Automated measurement of liver attenuation to identify moderate-to-severe hepatic steatosis from chest CT scans

Artit Jirapatnakul et al. Eur J Radiol. 2020 Jan.

Abstract

Purpose: Develop and validate an automated method for measuring liver attenuation in non-contrast low-dose chest CT (LDCT) scans and compare it to the standard manual method for identifying moderate-to-severe hepatic steatosis (HS).

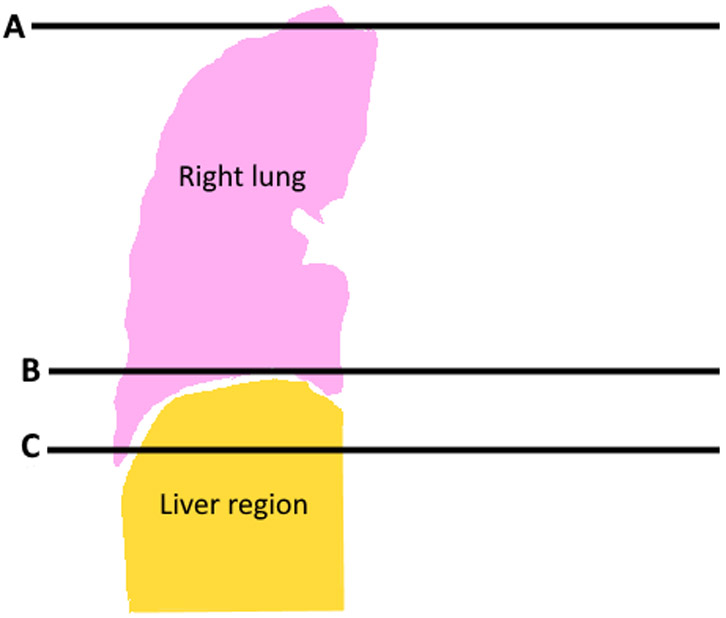
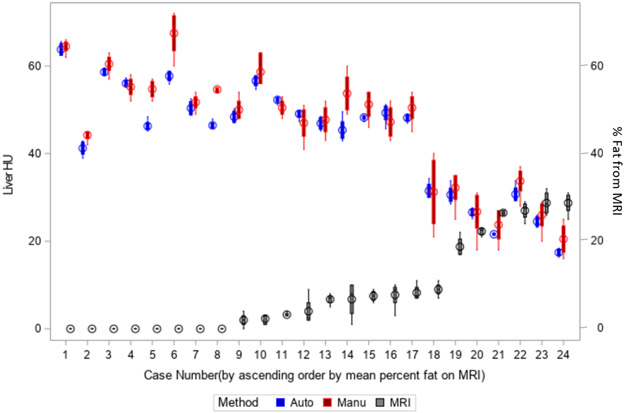
Method: The automated method identifies a region below the right lung within the liver and uses statistical sampling techniques to exclude non-liver parenchyma. The method was used to assess moderate-to-severe HS on two IRB-approved cohorts: 1) 24 patients with liver disease examined between 1/2013-1/2017 with non-contrast chest CT and abdominal MRI scans obtained within three months of liver biopsy, and 2) 319 lung screening participants with baseline LDCT performed between 8/2011-1/2017. Agreement between the manual and automated CT methods, the manual MRI method, and pathology for determining moderate-to-severe HS was assessed using Cohen's Kappa by applying a 40 HU threshold to the CT method and 17.4% fat fraction to MRI. Agreement between the manual and automated CT methods was assessed using the intraclass correlation coefficient (ICC). Variability was assessed using Bland-Altman limits of agreement (LoA).

Results: In the first cohort, the manual and automated CT methods had almost perfect agreement (ICC = 0.97, κ = 1.00) with LoA of -7.6 to 4.7 HU. Both manual and automated CT methods had almost perfect agreement with MRI (κ = 0.90) and substantial agreement with pathology (κ = 0.77). In the second cohort, the manual and automated CT methods had almost perfect agreement (ICC = 0.94, κ = 0.87). LoA were -10.6 to 5.2 HU.

Conclusion: Automated measurements of liver attenuation from LDCT scans can be used to identify moderate-to-severe HS on LDCT.

Keywords: Hepatic steatosis; Image analysis; Low-dose CT; Lung screening.


Figures

Figure 1.
Figure 1.
A coronal image of a) a chest LDCT scan using mediastinal windows, and b) a diagram of the LDCT image showing the right lung segmentation (pink) and the region containing the liver (tan). Line A indicates the axial CT slice that contains the highest point of the right hemi-diaphragm and line B indicates an area near the bottom of the right lung; these are referenced in subsequent figures.
Figure 1.
Figure 1.
A coronal image of a) a chest LDCT scan using mediastinal windows, and b) a diagram of the LDCT image showing the right lung segmentation (pink) and the region containing the liver (tan). Line A indicates the axial CT slice that contains the highest point of the right hemi-diaphragm and line B indicates an area near the bottom of the right lung; these are referenced in subsequent figures.
Figure 2.
Figure 2.
Plot of cross-sectional area of the right lung for each slice of a non-contrast chest CT scan. The CT slice at the top of the scan has a lower slice number than the CT slice at the bottom on the scan. Selected axial slices of the CT scan are labeled on the plot, with the corresponding images below the plot. Starting from the bottom of the lung (right side of the plot, indicated as point B), the cross sectional area of the lung slowly increases, then increases rapidly before reaching a peak (point A) and decreasing again. The top of the diaphragm for the right lung is located on slice 315 with an area of 188.6 cm2, indicated as A. Point B (area=3.4 cm2) represents a slice near the bottom of the lung and is included to provide a visual reference.
Figure 2.
Figure 2.
Plot of cross-sectional area of the right lung for each slice of a non-contrast chest CT scan. The CT slice at the top of the scan has a lower slice number than the CT slice at the bottom on the scan. Selected axial slices of the CT scan are labeled on the plot, with the corresponding images below the plot. Starting from the bottom of the lung (right side of the plot, indicated as point B), the cross sectional area of the lung slowly increases, then increases rapidly before reaching a peak (point A) and decreasing again. The top of the diaphragm for the right lung is located on slice 315 with an area of 188.6 cm2, indicated as A. Point B (area=3.4 cm2) represents a slice near the bottom of the lung and is included to provide a visual reference.
Figure 3.
Figure 3.
Liver region of interest identified on chest CT. A 3D reconstructed image in the coronal plane (A) and sagittal plane (B) and axial non-contrast CT images at two different levels (C and D) show the lung (pink) and right liver region (tan).
Figure 3.
Figure 3.
Liver region of interest identified on chest CT. A 3D reconstructed image in the coronal plane (A) and sagittal plane (B) and axial non-contrast CT images at two different levels (C and D) show the lung (pink) and right liver region (tan).
Figure 3.
Figure 3.
Liver region of interest identified on chest CT. A 3D reconstructed image in the coronal plane (A) and sagittal plane (B) and axial non-contrast CT images at two different levels (C and D) show the lung (pink) and right liver region (tan).
Figure 3.
Figure 3.
Liver region of interest identified on chest CT. A 3D reconstructed image in the coronal plane (A) and sagittal plane (B) and axial non-contrast CT images at two different levels (C and D) show the lung (pink) and right liver region (tan).
Figure 4.
Figure 4.
Histogram of mean intensity of the 1 cm3 cubes of the liver region of interest a) with all cubes and b) after keeping only the cubic sub-regions within the first and third quartiles (inner quartile range (IQR). Blue line indicates the median, black dashed lines indicate the limits of the IQR.
Figure 4.
Figure 4.
Histogram of mean intensity of the 1 cm3 cubes of the liver region of interest a) with all cubes and b) after keeping only the cubic sub-regions within the first and third quartiles (inner quartile range (IQR). Blue line indicates the median, black dashed lines indicate the limits of the IQR.
Figure 5.
Figure 5.
Comparison of the variation of the automated and manual CT methods. a) Box plot (showing the range, median and 1st and 3rd quartiles) for automated (blue) and manual CT (red) methods and MRI (black) method on the 24 patients in the liver disease cohort. B) Standard deviation for each of the 319 participants in the lung screening cohort, separately for the automated CT (blue) and manual CT (red) methods. The automated method had a smaller standard deviation than the manual method. A line is drawn at 5.0 Hounsfield Units (HU) standard deviation; all of the measurements by the automated method had a standard deviation below 5.0 HU, while 80/319 participants had a standard deviation above 5.0 HU for the manual method.
Figure 5.
Figure 5.
Comparison of the variation of the automated and manual CT methods. a) Box plot (showing the range, median and 1st and 3rd quartiles) for automated (blue) and manual CT (red) methods and MRI (black) method on the 24 patients in the liver disease cohort. B) Standard deviation for each of the 319 participants in the lung screening cohort, separately for the automated CT (blue) and manual CT (red) methods. The automated method had a smaller standard deviation than the manual method. A line is drawn at 5.0 Hounsfield Units (HU) standard deviation; all of the measurements by the automated method had a standard deviation below 5.0 HU, while 80/319 participants had a standard deviation above 5.0 HU for the manual method.
Figure 6.
Figure 6.
Bland-Altman plots comparing the automated and manual CT methods for the a) liver disease cohort and b) the lung screening cohort.
Figure 6.
Figure 6.
Bland-Altman plots comparing the automated and manual CT methods for the a) liver disease cohort and b) the lung screening cohort.
Figure 7.
Figure 7.
Scatter plot of automated vs. manual liver attenuation values on LDCT and the best linear regression line (automated attenuation = 0.95*manual attenuation, R2=0.99). Lines are drawn at 40 HU showing the accepted manual threshold for moderate-to-severe HS.

References

    1. Bedogni G, Miglioli L, Masutti F, Tiribelli C, Marchesini G, Bellentani S, Prevalence of and risk factors for nonalcoholic fatty liver disease: the Dionysos nutrition and liver study, Hepatology 42(1) (2005) 44–52. - PubMed
    1. Tang A, Tan J, Sun M, Hamilton G, Bydder M, Wolfson T, Gamst AC, Middleton M, Brunt EM, Loomba R, Lavine JE, Schwimmer JB, Sirlin CB, Nonalcoholic fatty liver disease: MR imaging of liver proton density fat fraction to assess hepatic steatosis, Radiology 267(2) (2013) 422–31. - PMC - PubMed
    1. Tang A, Desai A, Hamilton G, Wolfson T, Gamst A, Lam J, Clark L, Hooker J, Chavez T, Ang BD, Middleton MS, Peterson M, Loomba R, Sirlin CB, Accuracy of MR imaging-estimated proton density fat fraction for classification of dichotomized histologic steatosis grades in nonalcoholic fatty liver disease, Radiology 274(2) (2015) 416–25. - PMC - PubMed
    1. Noureddin M, Lam J, Peterson MR, Middleton M, Hamilton G, Le TA, Bettencourt R, Changchien C, Brenner DA, Sirlin C, Loomba R, Utility of magnetic resonance imaging versus histology for quantifying changes in liver fat in nonalcoholic fatty liver disease trials, Hepatology 58(6) (2013) 1930–40. - PMC - PubMed
    1. Bohte AE, van Werven JR, Bipat S, Stoker J, The diagnostic accuracy of US, CT, MRI and 1H-MRS for the evaluation of hepatic steatosis compared with liver biopsy: a meta-analysis, European radiology 21(1) (2011) 87–97. - PMC - PubMed

Publication types