. 2019 Nov 28;16(1):240.
doi: 10.1186/s12974-019-1648-4.

Monocarboxylate transporter 1 promotes classical microglial activation and pro-inflammatory effect via 6-phosphofructo-2-kinase/fructose-2, 6-biphosphatase 3

Affiliations

Monocarboxylate transporter 1 promotes classical microglial activation and pro-inflammatory effect via 6-phosphofructo-2-kinase/fructose-2, 6-biphosphatase 3

Liang Kong et al. J Neuroinflammation. .

Abstract

Background: Microglia, the resident macrophages of central nervous system, have been initially categorized into two opposite phenotypes: classical activation related to pro-inflammatory responses and alternative activation corresponding with anti-inflammatory reactions and tissue remodeling. The correlation between metabolic pattern and microglial activation has been identified. However, little is known about the mechanism of metabolism-mediated microglia polarization and pro-inflammatory effect.

Methods: Metabolic alteration was analyzed in different phenotypes of microglia in vitro. LPS-induced neuroinflammation and sickness behavior mouse model was used to investigate the effect of lactate on classical microglial activation in vivo.

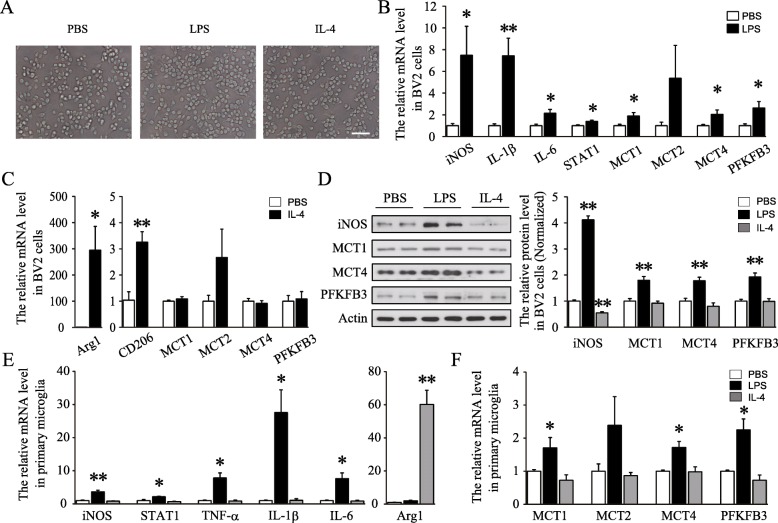
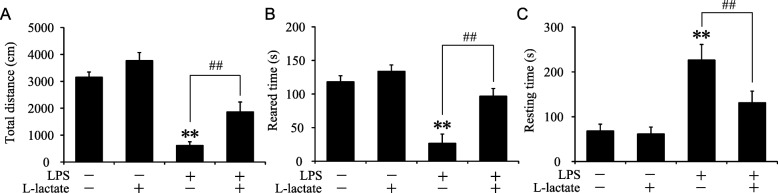
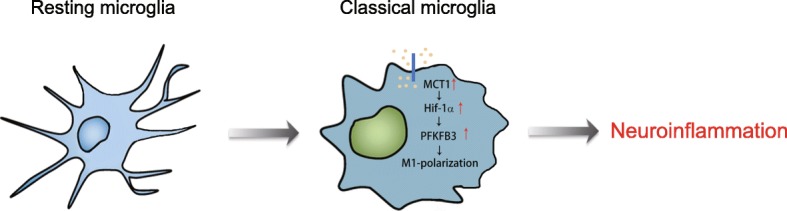
Results: Glycolysis-related regulators, monocarboxylate transporter 1 (MCT1), MCT4, and pro-glycolytic enzyme 6-phosphofructo-2-kinase/fructose-2, 6-biphosphatase 3 (PFKFB3), were specifically increased in LPS-stimulated primary microglia and microglia cell line BV2. Knockdown of MCT1 suppressed glycolysis rate and decreased LPS-induced expression of iNOS, interleukin-1β (IL-1β), IL-6, and phosphorylation of STAT1 in BV2 cells. Importantly, MCT1 promoted PFKFB3 expression via hypoxia-inducible factor-1α (Hif-1α), and overexpression of PFKFB3 restored the classical activation of BV2 cells suppressed by MCT1 silence. All above strongly suggested that MCT1/PFKFB3 might accelerate LPS-induced classical polarization of microglia probably by promoting glycolysis. Interestingly, additional administration of moderate lactate, which may block the transport function of MCT1, decreased LPS-induced classical activation and expression of PFKFB3 in BV2 cells. Intracerebroventricular injection of lactate ameliorated LPS-induced sickness behavior and classical polarization of microglia in mice.

Conclusions: Our results demonstrate the key role of MCT1 in microglial classical activation and neuroinflammation in pathological conditions. In addition, lactate administration may be a potential therapy to suppress neuroinflammation by altering microglial polarization.

Keywords: Classical microglial polarization; Glycolysis; Lactate; MCT1; Neuroinflammation; PFKFB3.


Conflict of interest statement

The authors declare that they have no competing interests.

Figures

Fig. 1
Fig. 1
LPS-induced special increase of MCT1, MCT4, and PFKFB3 in BV2 cell line and primary microglia. a Representative morphology of BV2 cells after treatment with PBS, LPS, or IL-4. Scale bar = 200 μm. b Quantification of the mRNA levels of classical microglial markers and glycolysis-related regulatory factors after treatment with LPS for 24 h (n = 6–8 per group and errors represent S.E.M; t test). c Quantification of the mRNA levels of alternative M2 markers and glycolysis-related regulatory factors after treatment of IL-4 for 24 h (n = 5 per group; t test). d Representative immunoblots and relative quantification of iNOS, MCT1, MCT4, and PFKFB3 after treatment with PBS, LPS, or IL-4 (n = 6 per group; one-way ANOVA). e, f Quantification of the mRNA levels of these genes in primary cultured microglia in each group (n = 6 per group one-way ANOVA). *p < 0.05, **p < 0.01 versus PBS-treated group
Fig. 2
Fig. 2
Knockdown of MCT1 inhibited LPS-stimulated classical microglial polarization and glycolysis rate in BV2 cells. a The interference efficiency of Lenti-siMCT1, Lenti-siMCT2, and Lenti-siMCT4, respectively, in BV2 cells (n = 6 per group and errors represent S.E.M; t test). b Quantification of the mRNA level of iNOS after treated with indicated lentivirus with or without LPS stimulation (n = 6–7 per group). c Quantification of the mRNA levels of IL-1β, IL-6, and STAT1, respectively, in each group (n = 5 per group). d Quantification of lactate levels in the cultured media in each group (n = 4 per group). e Quantification of the mRNA level of PFKFB3 in each group (n = 5–6 per group). f, g Representative immunoblots and relative quantification of iNOS, PFKFB3, and MCT1 in each group (n = 6 per group). h, i The real-time extracellular acidification rate was measured by the sequential addition of glucose, oligomycin, and 2-DG in each group (n = 5 per group). *p and #p < 0.05, **p and ##p < 0.01, two-way ANOVA followed by post hoc. Lenti-siCtr, Lenti-siMCT1, Lenti-siMCT2, and Lenti-siMCT4 are abbreviated as siCtr, siMCT1, siMCT2 and siMCT4, respectively
Fig. 3
Fig. 3
Overexpression of PFKFB3 rescued MCT1 silence-induced suppression of classical microglial polarization in BV2 cells. a Representative immunoblots and relative quantification of Hif-1α in each group (n = 4 per group and errors represent S.E.M). b The overexpression efficiency of Lenti-MCT1 and quantification of the mRNA level of PFKFB3 in each group (n = 4 per group). KC7F2, an inhibitor of Hif-1α, 30 mM. c, Quantification of the mRNA level of iNOS, IL-1β, and IL-6 after treatment with Lenti-siMCT1 and Lenti-PFKFB3 with or without LPS (n = 6–9 per group). d, e Representative immunoblots and relative quantification of iNOS and STAT1 protein, respectively, 24 h after LPS stimulation in each group (n = 6 per group). f Representative immunoblots and relative quantification of STAT1 and p-STAT1 after stimulation with LPS for 3 h in each group (n = 5–6 per group). *p, #p, and &p < 0.05, **p, ##p, and &&p < 0.01, NS represents no significant difference; two-way ANOVA followed by post hoc
Fig. 4
Fig. 4
Lactate suppressed LPS-induced classical microglial polarization in BV2 cells. a, b Quantification of the mRNA levels of iNOS and PFKFB3 in the treatment of lactate and LPS in BV2 cells (n = 9 per group and errors represent S.E.M). *p < 0.05, **p, and ##p < 0.01, two-way ANOVA followed by post hoc. ce Quantification of the mRNA levels of IL-1β, IL-6, and Hif-1α in the treatment of lactate, pyruvate, and LPS in BV2 cells (n = 4–7 per group one-way ANOVA)
Fig. 5
Fig. 5
Intracerebroventricular injection of lactate reduced classical microglial polarization and neuroinflammation in the hippocampus and substantia nigra. a, b Quantification of the mRNA levels of microglial M1 and M2 markers in the hippocampus and substantia nigra, respectively, after intraperitoneal injection of LPS and intraventricular injection of L-lactate (n = 6–9 per group). c, d Immunostaining of classical microglia markers, CD86, and Iba1, and quantification of Iba1+ cells and CD86+ cells in the hippocampus in each group (n = 5–6 per group). *p and #p < 0.05, **p and ##p < 0.01, two-way ANOVA followed by post hoc. Scale bar = 50 μm
Fig. 6
Fig. 6
Intracerebroventricular injection of lactate ameliorated LPS-induced sickness behavior in mice. ac Quantification of mice total distance, reared times, and resting times by open field tests after intraperitoneal injection of LPS and intraventricular injection of L-lactate (n = 8 per group and errors represent S.E.M, **p and ##p < 0.01; two-way ANOVA followed by post hoc)
Fig. 7
Fig. 7
Schematic representation of MCT1/PFKFB3-mediated classical microglial activation and pro-inflammatory effect

References

    1. Prinz M, Priller J. Microglia and brain macrophages in the molecular age: from origin to neuropsychiatric disease. Nat Rev Neurosci. 2014;15:300–312. doi: 10.1038/nrn3722. - DOI - PubMed
    1. Hu X, Li P, Guo Y, Wang H, Leak RK, Chen S, Gao Y, Chen J. Microglia/macrophage polarization dynamics reveal novel mechanism of injury expansion after focal cerebral ischemia. Stroke. 2012;43:3063–3070. doi: 10.1161/STROKEAHA.112.659656. - DOI - PubMed
    1. Lee Y, Lee SR, Choi SS, Yeo HG. Therapeutically targeting neuroinflammation and microglia after acute ischemic stroke. Biomed Res Int. 2014;2014:297241. - PMC - PubMed
    1. Lemarchant S, Dunghana H, Pomeshchik Y, Leinonen H, Kolosowska N, Korhonen P, Kanninen KM, Garcia-Berrocoso T, Montaner J, Malm T, Koistinaho J. Anti-inflammatory effects of ADAMTS-4 in a mouse model of ischemic stroke. Glia. 2016;64:1492–1507. doi: 10.1002/glia.23017. - DOI - PubMed
    1. Wang Y, Ulland TK, Ulrich JD, Song W, Tzaferis JA, Hole JT, Yuan P, Mahan TE, Shi Y, Gilfillan S, et al. TREM2-mediated early microglial response limits diffusion and toxicity of amyloid plaques. J Exp Med. 2016;213:667–675. doi: 10.1084/jem.20151948. - DOI - PMC - PubMed

MeSH terms