. 2019 Nov 28;20(1):258.
doi: 10.1186/s13059-019-1866-1.

547 transcriptomes from 44 brain areas reveal features of the aging brain in non-human primates

Affiliations

547 transcriptomes from 44 brain areas reveal features of the aging brain in non-human primates

Ming-Li Li et al. Genome Biol. .

Erratum in

Abstract

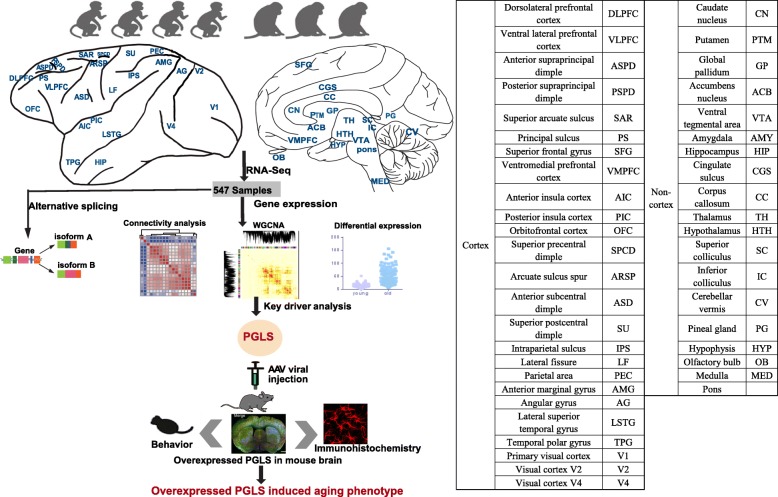
Background: Brain aging is a complex process that depends on the precise regulation of multiple brain regions; however, the underlying molecular mechanisms behind this process remain to be clarified in non-human primates.

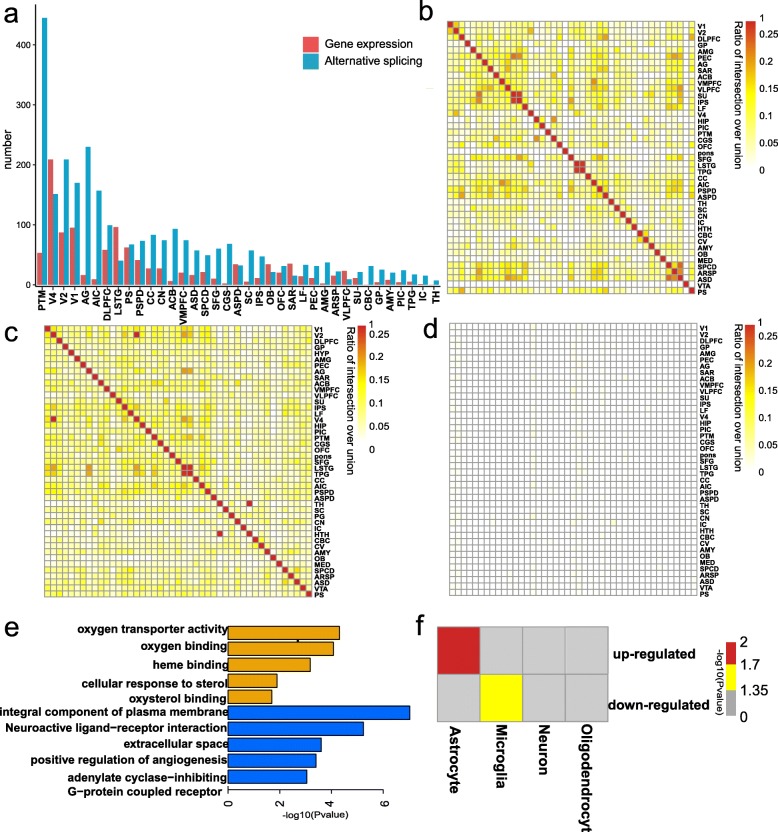
Results: Here, we explore non-human primate brain aging using 547 transcriptomes originating from 44 brain areas in rhesus macaques (Macaca mulatta). We show that expression connectivity between pairs of cerebral cortex areas as well as expression symmetry between the left and right hemispheres both decrease after aging. Although the aging mechanisms across different brain areas are largely convergent, changes in gene expression and alternative splicing vary at diverse genes, reinforcing the complex multifactorial basis of aging. Through gene co-expression network analysis, we identify nine modules that exhibit gain of connectivity in the aged brain and uncovered a hub gene, PGLS, underlying brain aging. We further confirm the functional significance of PGLS in mice at the gene transcription, molecular, and behavioral levels.

Conclusions: Taken together, our study provides comprehensive transcriptomes on multiple brain regions in non-human primates and provides novel insights into the molecular mechanism of healthy brain aging.

Keywords: Brain aging; Multiple brain regions; PGLS; Rhesus macaques; Transcriptome.


Conflict of interest statement

The authors declare that they have no competing interests.

Figures

Fig. 1
Fig. 1
Schematic view of this study. We used 4 young and 3 aged macaques across 44 brain regions to study aging mechanism in NHPs through multifaceted analyses (connectivity analysis, differentially expressed gene analysis, alternative splicing analysis, and network analysis). We further confirmed the role of PGLS underlying brain aging in mice. The table on the right shows the ontology and nomenclature of analyzed brain regions
Fig. 2
Fig. 2
Expression connectivity between pairs of cerebral cortex areas and expression symmetry between the left and right hemispheres decrease after aging. a Heat map matrix of pairwise Pearson correlations between cortex regions (top) and between non-cortex areas (bottom) in young and aged macaques. b Heatmap matrix of pairwise Pearson correlations between the left and right hemispheres in cortex (top) and non-cortex (bottom) regions in young and aged macaques (columns represent brain areas across the left hemisphere; rows represent brain areas across the right hemisphere)
Fig. 3
Fig. 3
Aging-related transcriptional profile changes. a The number of genes with evidence of aging-related gene expression (red) and aging-related alternative splicing (blue) changes. b The overlapping rate of DEGs between any two brain regions (the ratio of intersection over union was used to exhibit the overlapping rate). c The overlapping rate of genes with DEUs between any two brain regions. d The overlapping rate of DEUs and genes with DEGs between any two brain regions. e Enriched categories for upregulated (top) and downregulated (bottom) DEGs in aged macaques. f Matrix summary of enrichment in oligodendrocyte, neuron, microglia, endothelial, or astrocyte genes in upregulated and downregulated DEGs of aged macaques
Fig. 4
Fig. 4
Weighted gene co-expression network analysis (WGCNA). a In total, 56 modules were identified by WGCNA. b Significant (FET p value after correcting for number of modules and functional categories/pathways tested) enrichment of functional categories in modules with gains of connectivity. Y-axis represents – log (p value) of enrichment; x-axis denotes number of genes per module. c Circos plots displaying degree of enrichment for DEGs in aged-brain modules. Outermost rectangle is an arbitrary color for module name, followed by MDC score and then by importance (a measure considering degree of enrichment for DEGs across brain regions). Innermost concentric circles represent degree to which DEGs are contained within a given module for each brain region. d Circos plots displaying degree of enrichment for cell types in aged-brain modules. Outermost rectangle is an arbitrary color for module name, followed by importance (a measure considering degree of enrichment for cell types). Innermost concentric circles represent enrichment for genes with fivefold higher expression in oligodendrocyte, neuron, microglia, endothelial, or astrocyte cell types (Zhang et al. [94]) in aged-brain modules. e Functional enrichment of genes in brown module. f Network plot of hub genes identified within brown module. Blue nodes indicate all genes. Red nodes indicate hub genes. Yellow halos indicate aged-specific hub genes. Cyan node indicates gene PGLS for functional validation. Edges reflect significant interactions between genes based on mutual information
Fig. 5
Fig. 5
Overexpression of PGLS gene in mice causes aging phenotypes. a Immunostaining of coronal sections of brains from AAV-PGLS and control (Ctrl) mice for GFP (green) and PGLS (red). Scale bars: large = 1 mm, middle = 100 μm, and small = 10 μm. b Fluorescence intensity of PGLS protein detected by anti-PGLS antibody obtained from GFP-positive cells was quantified and averaged (unpaired t test with Welch’s correction: hippocampus p = 0.0002, temporal lobe p = 0.022, parietal lobe p = 0.0259, striatum p = 0.001, occipital p = 0.0366, prefrontal cortex p = 0.0011, and total p < 0.0001). c Representative immunoblots of PGLS in brains from AAV-PGLS and Ctrl mice at 12 months of age. d Protein expression level of PGLS in brains from AAV-PGLS and Ctrl mice (unpaired t test with Welch’s correction, p = 0.0123). e Latencies (second) during training in Morris water maze of PGLS with Ctrl (n = 8 mice, two-way ANOVA with Bonferroni’s multiple comparison test.). f Time (second) spent in goal quadrant during Morris water maze probe trial (n = 8, unpaired t test with Welch’s correction, t = 3.364, p = 0.0078). g Number of platform crossings during Morris water maze probe trial (n = 8, unpaired t test, t = 2.497, p = 0.0256). h Swimming distance (cm) to platform during Morris water maze probe trial (n = 8, unpaired t test, t = 4.244, p = 0.0008). i Examples of results obtained from open field test trace image (left). Total distance traveled (n = 8, unpaired t test, t = 2.296, p = 0.0376) in open field test during a 20-min period (right). j Cumulative food intake over a 24-h period (n = 8, repeated-measure ANOVA, F = 3.169, ***p < 0.0001, ηp2 = 0.303). k Total excretions (g) in 24 h (n = 8, unpaired t test, t = 2.747, p = 0.0157)
Fig. 6
Fig. 6
Molecular functional study of PGLS. a Soma size of GFAP-positive astrocytes was substantially larger in AAV-PGLS mice than in control (Ctrl) mice in most brain regions (unpaired test or unpaired t test with Welch’s correction: hippocampus p = 0.0158, temporal cortex p < 0.0001, prefrontal cortex p = 0.7358, stratum p = 0.0008, and total p = 0.001; scale bars: large = 100 μm and small = 10 μm). b Example photomicrograph of fluorescent IHC and cropped cell with skeletonized image. AAV-PGLS group (n = 10 cells) had significantly shorter branch length and more slab voxels than AAV-control group (n = 10 cells) (branch length: unpaired t test with Welch’s correction t = 2.709, p = 0.019; slab voxels: unpaired t test with Welch’s correction t = 5.17, p = 0.0004). c Functional enrichment of differentially expressed genes after overexpression of PGLS. d Representative immunoblots of PSD95 and caspase-3 in brains from AAV-PGLS and Ctrl mice at 12 months of age (p = 0.0094 for PSD95; p = 0.0383 for caspase-3; unpaired t test with Welch’s correction)

Similar articles

  • Regional and aging-specific cellular architecture of non-human primate brains.
    Wang YM, Wang WC, Pan Y, Zeng L, Wu J, Wang ZB, Zhuang XL, Li ML, Cooper DN, Wang S, Shao Y, Wang LM, Fan YY, He Y, Hu XT, Wu DD. Wang YM, et al. Genome Med. 2025 Apr 28;17(1):41. doi: 10.1186/s13073-025-01469-x. Genome Med. 2025. PMID: 40296047 Free PMC article.
  • A comprehensive transcriptional map of primate brain development.
    Bakken TE, Miller JA, Ding SL, Sunkin SM, Smith KA, Ng L, Szafer A, Dalley RA, Royall JJ, Lemon T, Shapouri S, Aiona K, Arnold J, Bennett JL, Bertagnolli D, Bickley K, Boe A, Brouner K, Butler S, Byrnes E, Caldejon S, Carey A, Cate S, Chapin M, Chen J, Dee N, Desta T, Dolbeare TA, Dotson N, Ebbert A, Fulfs E, Gee G, Gilbert TL, Goldy J, Gourley L, Gregor B, Gu G, Hall J, Haradon Z, Haynor DR, Hejazinia N, Hoerder-Suabedissen A, Howard R, Jochim J, Kinnunen M, Kriedberg A, Kuan CL, Lau C, Lee CK, Lee F, Luong L, Mastan N, May R, Melchor J, Mosqueda N, Mott E, Ngo K, Nyhus J, Oldre A, Olson E, Parente J, Parker PD, Parry S, Pendergraft J, Potekhina L, Reding M, Riley ZL, Roberts T, Rogers B, Roll K, Rosen D, Sandman D, Sarreal M, Shapovalova N, Shi S, Sjoquist N, Sodt AJ, Townsend R, Velasquez L, Wagley U, Wakeman WB, White C, Bennett C, Wu J, Young R, Youngstrom BL, Wohnoutka P, Gibbs RA, Rogers J, Hohmann JG, Hawrylycz MJ, Hevner RF, Molnár Z, Phillips JW, Dang C, Jones AR, Amaral DG, Bernard A, Lein ES. Bakken TE, et al. Nature. 2016 Jul 21;535(7612):367-75. doi: 10.1038/nature18637. Epub 2016 Jul 13. Nature. 2016. PMID: 27409810 Free PMC article.
  • The testicular transcriptome associated with spermatogonia differentiation initiated by gonadotrophin stimulation in the juvenile rhesus monkey (Macaca mulatta).
    Ramaswamy S, Walker WH, Aliberti P, Sethi R, Marshall GR, Smith A, Nourashrafeddin S, Belgorosky A, Chandran UR, Hedger MP, Plant TM. Ramaswamy S, et al. Hum Reprod. 2017 Oct 1;32(10):2088-2100. doi: 10.1093/humrep/dex270. Hum Reprod. 2017. PMID: 28938749 Free PMC article.
  • Calorie restriction in nonhuman primates: assessing effects on brain and behavioral aging.
    Ingram DK, Young J, Mattison JA. Ingram DK, et al. Neuroscience. 2007 Apr 14;145(4):1359-64. doi: 10.1016/j.neuroscience.2006.10.031. Epub 2007 Jan 16. Neuroscience. 2007. PMID: 17223278 Review.
  • Aging and caloric restriction in nonhuman primates: behavioral and in vivo brain imaging studies.
    Ingram DK, Chefer S, Matochik J, Moscrip TD, Weed J, Roth GS, London ED, Lane MA. Ingram DK, et al. Ann N Y Acad Sci. 2001 Apr;928:316-26. doi: 10.1111/j.1749-6632.2001.tb05661.x. Ann N Y Acad Sci. 2001. PMID: 11795523 Review.

Cited by

References

    1. Koivisto K, Reinikainen KJ, Hanninen T, Vanhanen M, Helkala EL, Mykkanen L, Laakso M, Pyorala K, Riekkinen PJ. Prevalence of age-associated memory impairment in a randomly selected population from eastern Finland. Neurology. 1995;45:741. doi: 10.1212/WNL.45.4.741. - DOI - PubMed
    1. Montesanto A, Dato S, Bellizzi D, Rose G, Passarino G. Epidemiological, genetic and epigenetic aspects of the research on healthy ageing and longevity. Immun Ageing. 2012;9:6. doi: 10.1186/1742-4933-9-6. - DOI - PMC - PubMed
    1. Raz N, Lindenberger U, Rodrigue KM, Kennedy KM, Head D, Williamson A, Dahle C, Gerstorf D, Acker JD. Regional brain changes in aging healthy adults: general trends, individual differences and modifiers. Cereb Cortex. 2005;15:1676–1689. doi: 10.1093/cercor/bhi044. - DOI - PubMed
    1. Haddadi M, Jahromi SR, Sagar BKC, Patil RK, Shivanandappa T, Ramesh SR. Brain aging, memory impairment and oxidative stress: a study in Drosophila melanogaster. Behav Brain Res. 2014;259:60–69. doi: 10.1016/j.bbr.2013.10.036. - DOI - PubMed
    1. Mariani E, Polidori MC, Cherubini A, Mecocci P. Oxidative stress in brain aging, neurodegenerative and vascular diseases: an overview. J Chromatogr B. 2005;827:65–75. doi: 10.1016/j.jchromb.2005.04.023. - DOI - PubMed

Publication types

Substances