. 2020 Jan 8;105(1):75-92.e5.
doi: 10.1016/j.neuron.2019.10.008. Epub 2019 Nov 25.

GABAergic Restriction of Network Dynamics Regulates Interneuron Survival in the Developing Cortex

Affiliations

GABAergic Restriction of Network Dynamics Regulates Interneuron Survival in the Developing Cortex

Zhe Ran S Duan et al. Neuron. .

Abstract

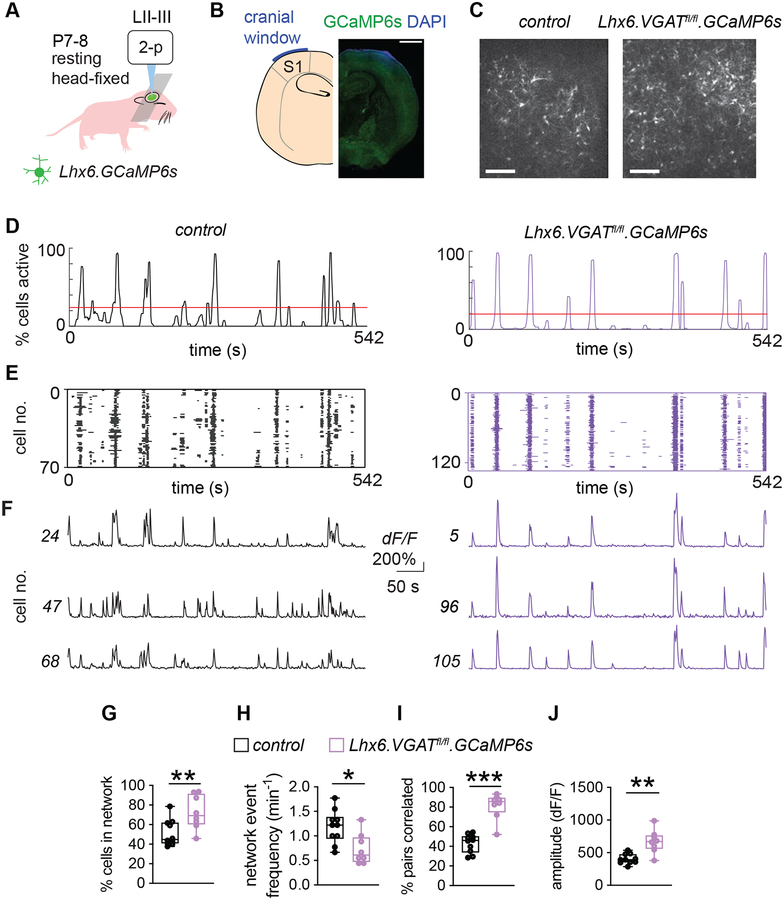
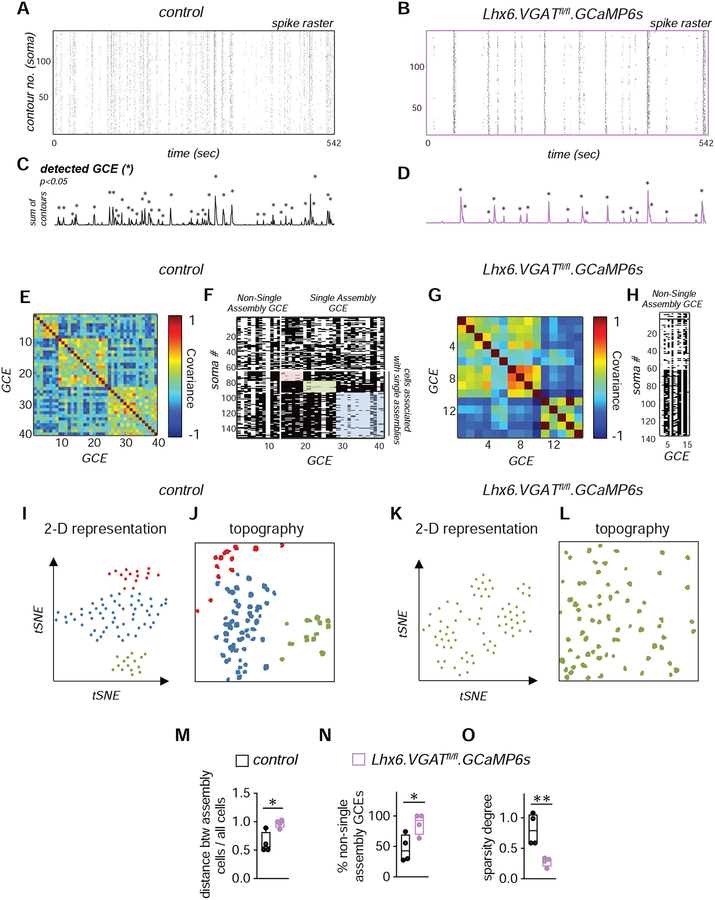
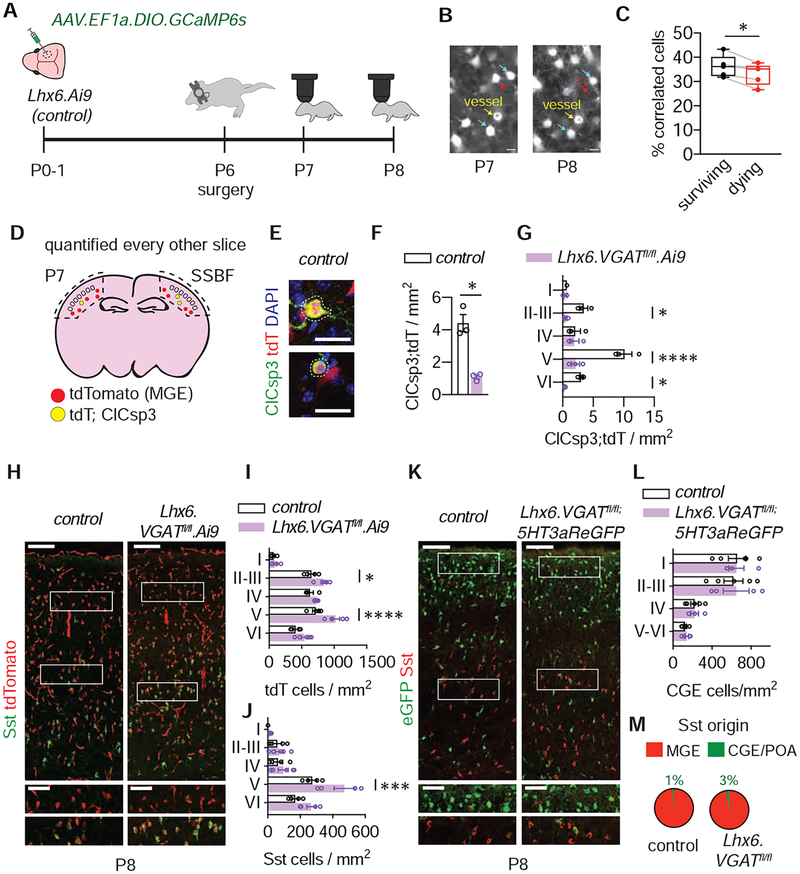
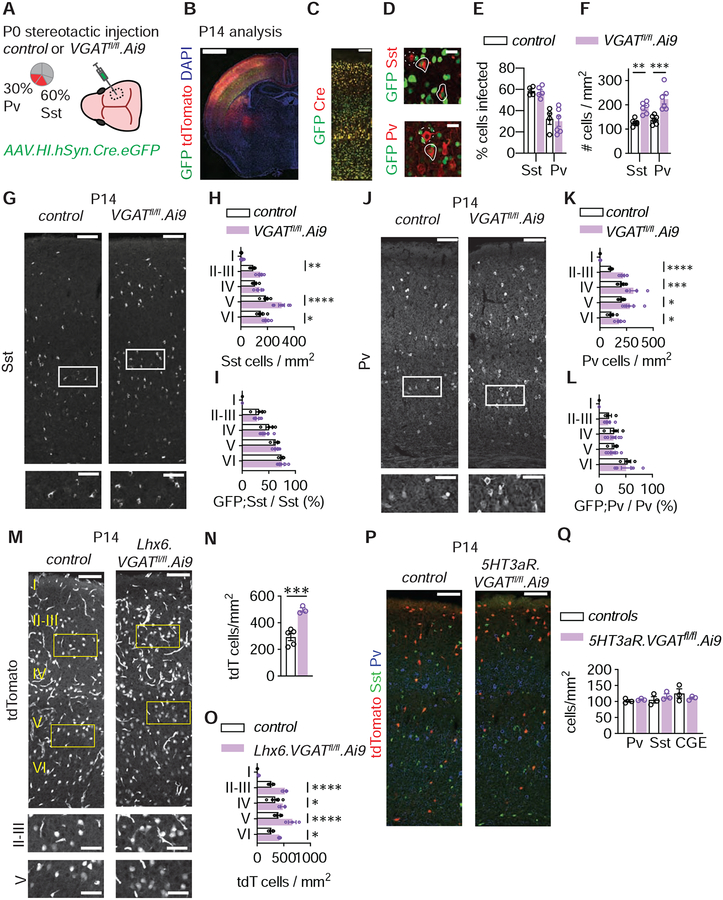
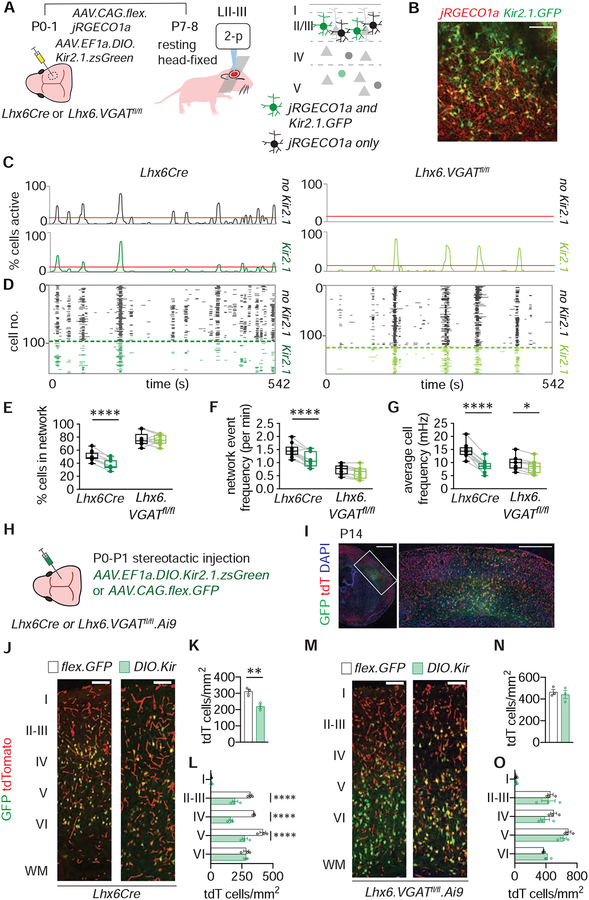
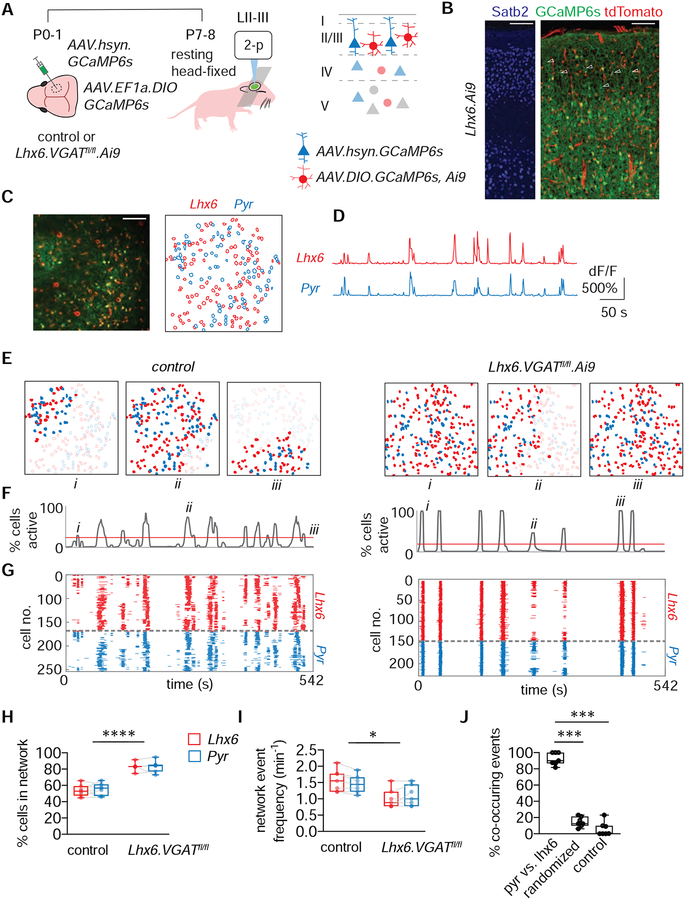
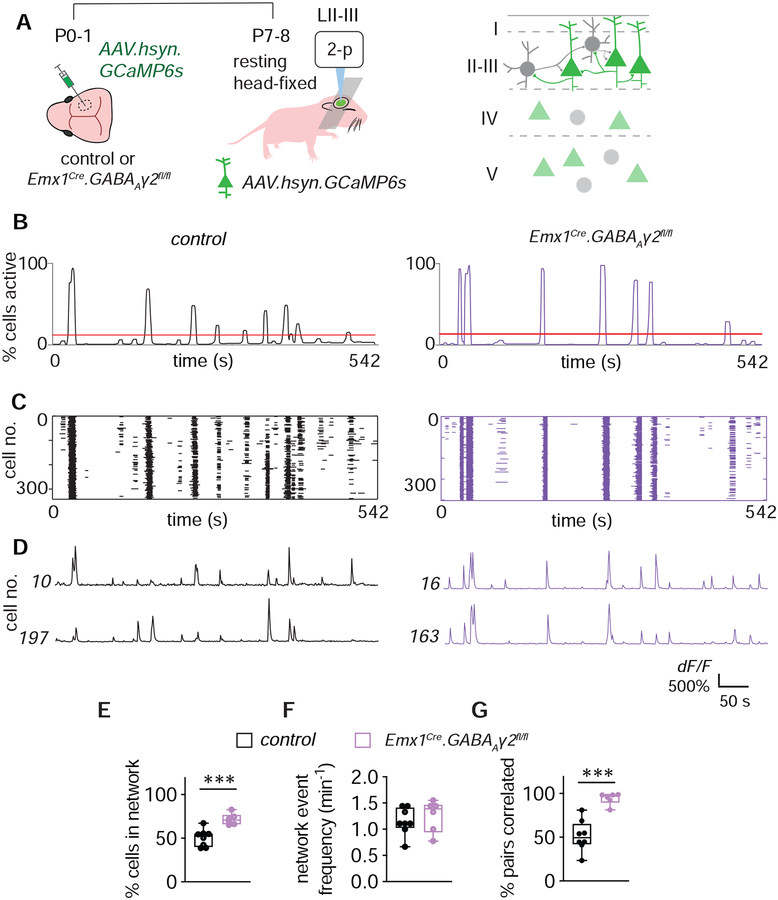
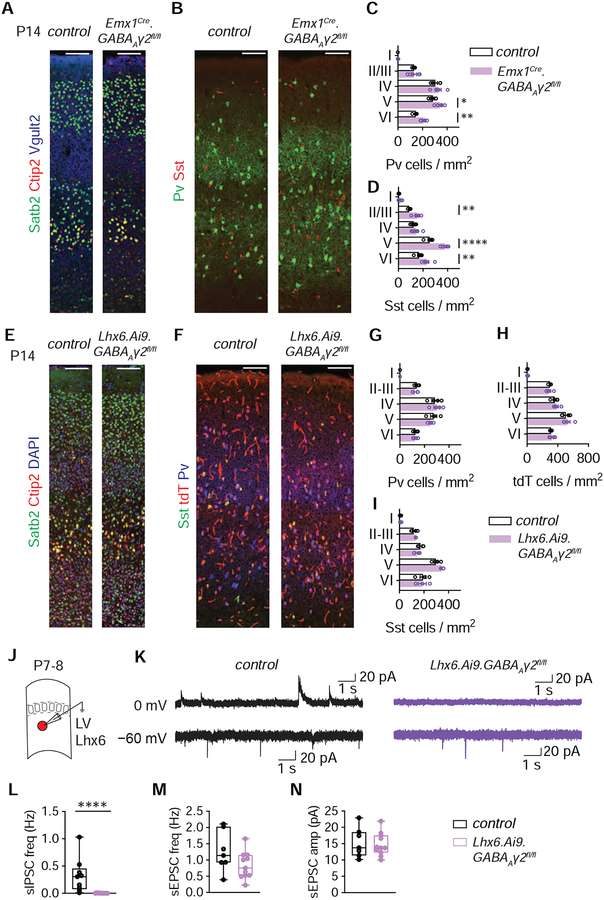
During neonatal development, sensory cortices generate spontaneous activity patterns shaped by both sensory experience and intrinsic influences. How these patterns contribute to the assembly of neuronal circuits is not clearly understood. Using longitudinal in vivo calcium imaging in un-anesthetized mouse pups, we show that spatially segregated functional assemblies composed of interneurons and pyramidal cells are prominent in the somatosensory cortex by postnatal day (P) 7. Both reduction of GABA release and synaptic inputs onto pyramidal cells erode the emergence of functional topography, leading to increased network synchrony. This aberrant pattern effectively blocks interneuron apoptosis, causing increased survival of parvalbumin and somatostatin interneurons. Furthermore, the effect of GABA on apoptosis is mediated by inputs from medial ganglionic eminence (MGE)-derived but not caudal ganglionic eminence (CGE)-derived interneurons. These findings indicate that immature MGE interneurons are fundamental for shaping GABA-driven activity patterns that balance the number of interneurons integrating into maturing cortical networks.

Keywords: GDPs; MGE; apoptosis; barrel cortex; calcium imaging; cell death; development; interneuron; spontaneous activity.


Conflict of interest statement

Declaration of Interests

The authors declare no competing interests.

Figures

Figure 1.
Figure 1.. GABAergic activity restricts MGE-cIN participation in synchronous network events in vivo.
(A) 2-photon imaging of unanesthetized pups at P7–8 (B) Cranial window location indicated by DAPI in the the somatosensory barrel field (SSBF). Scale bar 1mm (C) Examples of single-frame 2-photon images showing GCaMP6s expression in MGE-cINs. Scale bar 100μm (D) Representative event histogram in Lhx6Cre (control, left) and Lhx6.VGATfl/fl.GCaMP6s (right) mice. Red line indicates threshold for network event detection (E) Corresponding rastergrams to (D) (F) Representative dF/F traces (G) Percentage of cells participating in network events (control: n=10 movies, 4 mice and Lhx6.VGATfl/fl.GCaMP6s: n=8 movies, 4 mice; Unpaired t-test p=0.0096) (H) Frequency of network events in MGE-cINs (Unpaired t-test p=0.0103) (I) Percentage of pairs correlated (Mann Whitney p=0.0002) (J) Average event amplitude of single cells (Unpaired t-test with Welch’s p=0.0031) Data are represented by median and interquartile range. *p<0.05, **p<0.01, ***p<0.001.
Figure 2.
Figure 2.. GABA controls the emergence of MGE-cIN assemblies in vivo.
(A,B) Representative rasterplots of all spikes deconvolved from calcium traces in control (A) and Lhx6.VGATfl/fl.GCaMP6s mice (B) as a function of time (C,D) Sum of active contours over time corresponding to (A) and (B). Stars indicate detected synchronous GABAergic calcium events (GCEs) based on a statistical threshold of p<0.05 (E,G) Representative covariance matrices for all GCEs corresponding to (A) and (B) (F,H) Representative rasterplots of detected active cells and GCEs sorted according to the set of interneurons recruited (I,K) Representative tSNE showing a 2-D representation of functional correlation of local structure (cells) and global structure (assemblies), color-coded according to their functional assemblies displayed in (F) and (H) (J,L) Representative topographic maps of cells participating in functional correlated activity assemblies displayed in (G) and (H) (M) Ratio between the physical distances of cells belonging to assemblies and all cells (control: 4 movies, 4 mice and Lhx6.VGATfl/fl.GCaMP6s: n=4 movies, 3 mice, Two-tailed unpaired t-test p=0.0132). Increased ratio indicates lack of spatial restriction in Lhx6.VGATfl/fl.GCaMP6s mice (N) Percentage of GCEs that do not recruit cells associated with single assemblies (Unpaired t-test p=0.0281). Increased percentage indicates fewer GCEs associated with single, spatially-restricted assemblies in Lhx6.VGATfl/fl.GCaMP6s mice (O) Network sparsity (the ratio of spikes outside to inside GCEs). Prevention of GABA release significantly decreases spikes outside GCEs (Unpaired t-test with Welch’s p=0.0076) Data represented by median and interquartile range. *p<0.05, **p<0.01.
Figure 3.
Figure 3.. Increased synchronous activity in MGE-cIN leads to increased interneuron survival.
(A) Schematics depicting the experimental design for longitudinal imaging of MGE-cINs. Imaging of same field of view (FOV) in LII/III was performed from P7 to P8 in Lhx6.Ai9 mice injected with AAV.EF1a.DIO.GCaMP6s virus (B) Representative maximum projections (+/− 20μm) of MGE-cINs (tdTomato) in the same FOV at P7 and P8. Blue arrows indicate interneurons present across both days; red arrow and dotted contour indicates interneuron present at P7 and absent at P8. Scale bar 10μm (C) Percentage of interneurons showing correlated activity with other interneurons in the FOV at P7 (n=5 movies, 3 mice, paired two-tailed t-test p=0.0316) (D) Analysis of interneuron apoptosis in the SSBF (E) Representative confocal images of cleaved caspase3 positive MGE-cINs in Lhx6.Ai9 (control) mice at P7. Scale bar 10μm (F) Density of tdT;ClCsp3+ neurons across laminae in control and Lhx6.VGATfl/fl.Ai9 mice (control: n=3 mice and Lhx6.VGATfl/fl.Ai9: n=3 mice, Unpaired t-test with Welch’s p=0.0193) (G) Density of tdT;ClCsp3+ neurons per layer (2way ANOVA with Bonferroni, LI: p>0.999; LII-III: p=0.0160; LIV: p>0.999; LV: p<0.0001; LVI: p=0.0288) (H) Representative images of the SSBF in Lhx6.Ai9 (control) and Lhx6.VGATfl/fl.Ai9 mice at P8. Scale bar 100μm and 50μm in insets (I) Laminar density of tdTomato+ (MGE) interneurons (control: n=4 and Lhx6.VGATfl/fl.Ai9: n=5 mice; 2way ANOVA Bonferroni LI: p>0.999, LII-III: p=0.0178; LIV: p=0.5568; LV: p<0.0001; LVI: p=0.1669). Data also shown in Fig S4B (J) Laminar density of Sst interneurons (2way ANOVA with Bonferroni, LI: p>0.999; LII-III: p>0.999; LIV: p>0.999; LV: p=0.0006; LVI: p=0.1778) (K) Representative images of the SSBF in VGATfl/fl; 5Ht3aReGFP (control) and Lhx6.VGATfl/fl; 5Ht3aReGFP mice at P8. Scale bar 100μm and 50μm in insets (L) Laminar density of eGFP+ (CGE/POA) interneurons (control: n=5 and Lhx6.VGATfl/fl; 5Ht3aReGFP: 4 mice, 2way ANOVA with Bonferroni, all p>0.999). (M) Percentage of Sst interneurons co-expressing tdTomato (quantified from Lhx6.Ai9 and Lhx6.VGATfl/fl.Ai9 mice at P8; n=4 and 4 mice, Two-tailed unpaired t-test with Welch’s p=0.2693) or eGFP (quantified from VGATfl/fl; 5Ht3aReGFP (control) and Lhx6.VGATfl/fl; 5Ht3aReGFP mice at P8) (n=5 and 3 mice, p=0.4241) Data represented by mean and s.e.m. except median and interquartile range in 3C. *p<0.05, ***p<0.001, and ****p<0.0001.
Figure 4.
Figure 4.. Postnatal reduction of MGE-cIN output disrupts interneuron apoptosis.
(A) Schematic showing the experimental design for postnatal genetic ablation of VGAT (B) Low-magnification image of a P14 VGAT.Ai9 control brain injected at P0. Scale bar 1mm (C) Confocal images showing co-expression of eGFP and Cre in infected neurons. Scale bar 100μm (D) Confocal images showing co-expression of eGFP in Sst (top) and Pv (bottom) cINs (see 4G and 4J). Solid outlines indicate eGFP-expressing interneuron; dotted outlines indicate non-eGFP expressing interneuron. Scale bar 20μm (E) Percentage of eGFP and Sst double positive interneurons over the total number of Sst interneurons in Ai9 (control) and VGATfl/fl.Ai9 mice (control: n=4 and VGATfl/fl.Ai9: 5 mice; Unpaired t-test with Welch’s p>0.999) and eGFP; Pv double positive over the total number of Pv interneurons (control: n=4 and VGATfl/fl.Ai9: 6 mice; p>0.999) (F) Density of Sst and Pv interneurons in control and VGATfl/fl.Ai9 mice at P14 (n=6 and 6 mice, 2way ANOVA p<0.0001 with Bonferroni: Sst: p=0.0032; Pv: p=0.0001) (G) Representative images of Sst interneurons in P14 control and Ai9 VGATfl/fl mice injected with AAV.HI.hSyn.Cre.eGFP virus at P0. Scale 100μm and 50μm in insets (H) Laminar density of Sst interneurons in control and VGATfl/fl.Ai9 mice (control: n=6 and VGATfl/fl.Ai9: 6 mice; 2way ANOVA with Bonferroni LI: p>0.999; LII-III: p=0.0048; LIV: p=0.145; LV: p<0.0001; LVI: p=0.0288) (I) Percentage of infected Sst interneurons at P14 (control: n=4 and VGATfl/fl.Ai9: 5 mice; 2way ANOVA with Bonferroni, all layers p>0.9999 except LIV p=0.941) (J) Representative images of Pv interneurons in P14 control and Ai9.VGATfl/fl mice injected with AAV.HI.hSyn.Cre.eGFP virus at P0. Scale 100μm and 50μm in insets (K) Laminar density of Pv interneurons in control and VGATfl/fl.Ai9 mice (control: n=6 and VGATfl/fl.Ai9: 6 mice; 2way with Bonferroni LI: p>0.999; LII-III: p<0.0001; LIV: p=0.0002; LV: p=0.0137; LVI: p=0.0232) (L) Percentage of infected Pv interneurons at P14 (control: n=4 and VGATfl/fl.Ai9: 6 mice; 2way ANOVA with Bonferroni, all layers p>0.999) (M) Representative images of SSBF in control and Lhx6.VGATfl/fl.Ai9 mice at P14. Scale bar 100μm, and 50μm in insets (N,O) Density of MGE-cINs in control and Lhx6.VGATfl/fl.Ai9 mice at P14, overall (N) control: n=5 and Lhx6.VGATfl/fl.Ai9: 3 mice; Unpaired t-test with Welch’s p=0.0007 and by lamina (O) 2way ANOVA with Bonferroni I: p>0.9999; II-III: p<0.0001; IV: p=0.0406; V: p<0.0001; VI: p=0.0248). Data also shown in Fig S4B (P) Representative images of SSBF in control and 5Ht3aR.VGATfl/fl.Ai9 mice at P14. Scale bar 100μm (Q) Interneuron density in control and 5Ht3aR.VGATfl/fl.Ai9 mice at P14 (control: n=3 and 5Ht3aR.VGATfl/fl.Ai9: 3 mice; Unpaired t-test with Welch’s Pv: p=0.4393; Sst: p=0.4143; CGE: p=0.430) Data represented by mean and s.e.m. *p<0.05, **p<0.01, ***p<0.001, and ****p<0.0001.
Figure 5.
Figure 5.. Decreased participation in network activity leads to decreased MGE-cIN survival
(A) Experimental strategy for the imaging of Kir2.1-expressing MGE-cINs (B) Example of a 2-photon image averaged from 500 frames showing mosaic expression of jRGECO1a and Kir2.1 viruses in SSBF. Scale bar 100μm (C) Representative event histograms in MGE-cINs expressing only jRGECO1a (no Kir2.1) and in those expressing both jRGECO1a and Kir2.1 (Kir2.1), in Lhx6Cre (left) and Lhx6.VGATfl/fl mice (right). Red line indicates threshold for network event detection (D) Corresponding event rastergrams to (C) (E) Percentage of MGE-cINs participating in network events in Lhx6Cre and Lhx6.VGATfl/fl mice (Kir vs no Kir: 2way ANOVA with Bonferroni: Lhx6Cre: n=10 movies, 3 mice, p<0.0001; Lhx6.VGATfl/fl: n=9 movies, 2 mice, p>0.9999) (F) Frequency of network events (Kir vs no Kir: Lhx6Cre: p<0.0001; Lhx6.VGATfl/fl: p=0.1691) (G) Average frequency of calcium events per cell (Kir vs no Kir: Lhx6Cre: p<0.0001; Lhx6.VGATfl/fl: p=0.0102) (H) Experimental strategy for assessing the effect of Kir2.1 expression on MGE-cIN density (I) Representative image showing AAV.DIO.Kir2.1.zsGreen expression in SSBF. Scale bar 1mm (left) and 0.5mm (right) (J) Representative images of Lhx6.Ai9 mice injected with AAV.flex.eGFP (left) or AAV.DIO.Kir2.1.zsGreen (right) viruses. Scale bar 100μm (K) MGE-cIN density in Lhx6.Ai9 mice at P14 (n=3 GFP and 3 Kir2.1 mice; Unpaired t-test with Welch’s p=0.0092) (L) Laminar density in Lhx6.Ai9 mice (2way ANOVA with Bonferroni p<0.0001 in LII/III, IV, V; p>0.9999 in LI and IV) (M) Representative images of Lhx6.VGATfl/fl.Ai9 mice injected with AAV.flex.eGFP (left) or AAV.DIO.Kir2.1.zsGreen (right) viruses. Scale bar 100μm (N) MGE-cIN density in Lhx6.VGATfl/fl.Ai9 mice at P14 (n=3 GFP and 3 Kir2.1 mice, Unpaired t-test with Welch’s p=0.6386) (O) Laminar density in Lhx6.VGATfl/fl.Ai9 mice (2way ANOVA with Bonferroni p>0.9999 except p=0.3445 in LIV) Data represented by median and interquartile range in 5E-G and mean and s.e.m. in bar graphs. *p<0.05, **p<0.01, ****p<0.0001.
Figure 6.
Figure 6.. GABA restricts correlated network activity in both MGE-cINs and pyramidal cells in vivo.
(A) Experimental strategy for the simultaneous imaging of pyramidal cells and MGE-cINs in LII-III (right) at P7–8 (B) Expression of GCaMP6s in both MGE-cINs (filled arrows) and pyramidal cells in LII-III (outlined arrows). Satb2 labeling shows layer boundaries. Scale bars 100μm (C) Example of averaged 2-photon image showing expression of GCaMP6s in both MGE-cINs (red) and pyramidal cells (blue) with corresponding cell mask (right). Scale bar 100μm (D) Example dF/F traces for an MGE-cIN and pyramidal cell from the same movie (E) Examples of pyramidal cells (blue) and MGE-cINs (red) recruited during different network events (i-iii) in Lhx6.Ai9 (control) (left) and Lhx6.VGATfl/fl.Ai9 mice (right). Filled contours indicate neurons active during the network event (F) Representative event histograms in control (left) and Lhx6.VGATfl/fl.GCaMP6s (right) mice. Red line indicates threshold for network event detection. Network events (i-iii) corresponding to (E) are indicated (G) Corresponding event rastergrams to (F) sorted by neuronal type (H) Percentage of MGE-cINs and pyramidal cells participating in network events in control and Lhx6.VGATfl/fl mice (control vs Lhx6.VGATfl/fl: n=7 movies, 4 mice and 7 movies, 4 mice; 2way ANOVA with Bonferroni p<0.0001) (I) Frequency of network events (control vs Lhx6.VGATfl/fl: p=0.0121) (J) Percentage of co-occurring events (onset within 3 frames of each other) between pyramidal cells and MGE-cINs in the same movie, compared to that of interneuron and pyramidal cell network events from different movies (randomized, Mann-Whitney p=0.0006), or control single-population movies with the same number of network events (control, Mann-Whitney p=0.0006). n=7 movies for each comparison Data represented by median and interquartile range. *p<0.05, ***p<0.001, ****p<0.0001.
Figure 7.
Figure 7.. GABAergic inputs restrict pyramidal cell participation in network events in vivo.
(A) Experimental strategy for the imaging of pyramidal cell activity in LII-III (right) at P7–8 (B) Representative event histograms in control (left) and Emx1Cre.GABAAγ2fl/fl (right) mice. Red line indicates threshold for network event detection (C) Corresponding event rastergrams to (B) (D) Corresponding sample dF/F traces (E) Percentage of cells participating in network events in Emx1Cre (control) and Emx1Cre.GABAAγ2fl/fl mice (control: n=8 movies, 4 mice and mutant: n=6 movies, 3 mice; Unpaired t-test p=0.0006) (F) Frequency of network events (Unpaired t-test p=0.4920) (G) Percentage of pairs correlated (Mann-Whitney p=0.0007) Data represented by median and interquartile range. ***p<0.001.
Figure 8.
Figure 8.. GABAergic inputs to pyramidal cells—but not MGE-derived cortical interneurons—are required for MGE-cIN apoptosis.
(A) Representative laminar boundaries in Emx1Cre (control) and Emx1Cre.GABAAγ2fl/fl mice at P14. Scale bar 100μm (B) Representative images of Pv and Sst interneurons in SSBF in control and Emx1Cre.GABAAγ2fl/fl mice. Scale bar 100μm (C) Laminar density of Pv interneurons (n=5 control and 5 Emx1Cre.GABAAγ2fl/fl mice, 2way ANOVA with Bonferroni: LV p=0.0149, LVI p=0.0061, others p>0.9999) (D) Laminar density of Sst interneurons (LII-III: p=0.0025, LV p<0.0001, LVI p=0.0029, others p>0.9999) (E) Representative laminar boundaries in Lhx6Cre (control) and Lhx6.GABAAγ2fl/fl.Ai9 mice. Scale bar 100μm (F) Representative images of MGE-cINs in SSBF in control and Lhx6.GABAAγ2fl/fl.Ai9 mice. Scale bar 100μm (G) Laminar density of Pv interneurons (control n=4 and 4 Lhx6.GABAAγ2fl/fl.Ai9 mice, 2way ANOVA with Bonferroni: all p>0.9999). (H) Laminar density of tdT (Lhx6) interneurons (all p>0.9999) (I) Laminar density of Sst interneurons (n=4 and 3 mutant mice, 2way ANOVA with Bonferroni: LI p>0.9999, LII-III 0.9836, LIV p=0.7416, p=0.272, p=0.9997) (J) Schematics depicting the experimental design for whole-cell patch recordings of LV MGE-cINs (K) Example traces of sIPSCs (top) and sEPSCs (bottom) in LV MGE-cINs of Lhx6.Ai9 (control, left) and Lhx6.GABAAγ2fl/fl.Ai9 (right) mice (L) sIPSC frequency in LV MGE-cINs of control and Lhx6.GABAAγ2fl/fl.Ai9 mice (n=9 cells, 2 mice and 11 cells, 3 mice, Mann-Whitney p<0.0001) (M) sEPSC frequency (n=7 cells, 2 control mice and 11 cells, 3 mutant mice, Unpaired t-test p=0.0915) (N) sEPSC amplitude (n=7 cells, 2 control mice and 11 cells, 3 mutant mice, Unpaired t-test p=0.7839) Data represented by mean and s.e.m. except median and interquartile range in 8L-N. *p<0.05, **p<0.01, and ****p<0.0001.

Similar articles

Cited by

References

    1. Allene C, Cattani A, Ackman JB, Bonifazi P, Aniksztejn L, Ben-Ari Y, and Cossart R. 2008. ‘Sequential generation of two distinct synapse-driven network patterns in developing neocortex’, J Neurosci, 28: 12851–63. - PMC - PubMed
    1. Anastasiades PG, Marques-Smith A, Lyngholm D, Lickiss T, Raffiq S, Katzel D, Miesenbock G, and Butt SJ. 2016. ‘GABAergic interneurons form transient layer-specific circuits in early postnatal neocortex’, Nat Commun, 7: 10584. - PMC - PubMed
    1. Anderson SA, Eisenstat DD, Shi L, and Rubenstein JL. 1997. ‘Interneuron migration from basal forebrain to neocortex: dependence on Dlx genes’, Science, 278: 474–6. - PubMed
    1. Arlotta P, Molyneaux BJ, Chen J, Inoue J, Kominami R, and Macklis JD. 2005. ‘Neuronal subtype-specific genes that control corticospinal motor neuron development in vivo’, Neuron, 45: 207–21. - PubMed
    1. Ben-Ari Y, Cherubini E, Corradetti R, and Gaiarsa JL. 1989. ‘Giant synaptic potentials in immature rat CA3 hippocampal neurones’, J Physiol, 416: 303–25. - PMC - PubMed

Publication types

MeSH terms

LinkOut - more resources