. 2019 Nov 28;10(1):5415.
doi: 10.1038/s41467-019-13055-y.

Automated optimized parameters for T-distributed stochastic neighbor embedding improve visualization and analysis of large datasets

Affiliations

Automated optimized parameters for T-distributed stochastic neighbor embedding improve visualization and analysis of large datasets

Anna C Belkina et al. Nat Commun. .

Abstract

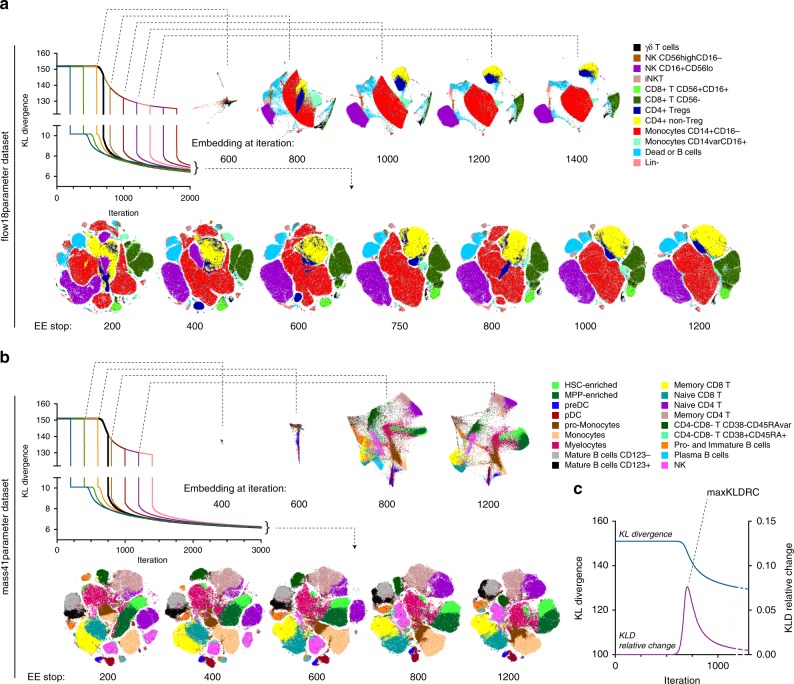
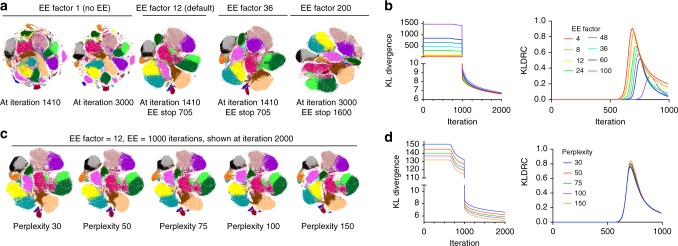
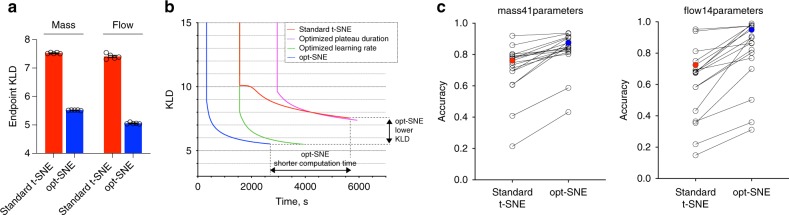
Accurate and comprehensive extraction of information from high-dimensional single cell datasets necessitates faithful visualizations to assess biological populations. A state-of-the-art algorithm for non-linear dimension reduction, t-SNE, requires multiple heuristics and fails to produce clear representations of datasets when millions of cells are projected. We develop opt-SNE, an automated toolkit for t-SNE parameter selection that utilizes Kullback-Leibler divergence evaluation in real time to tailor the early exaggeration and overall number of gradient descent iterations in a dataset-specific manner. The precise calibration of early exaggeration together with opt-SNE adjustment of gradient descent learning rate dramatically improves computation time and enables high-quality visualization of large cytometry and transcriptomics datasets, overcoming limitations of analysis tools with hard-coded parameters that often produce poorly resolved or misleading maps of fluorescent and mass cytometry data. In summary, opt-SNE enables superior data resolution in t-SNE space and thereby more accurate data interpretation.


Conflict of interest statement

C.O.C. is a founder of Omiq, Inc. R.H. and J.S. are employees of Beckton Dickinson (BD); FlowJo is a subsidiary of BD. The remaining authors declare no competing interests.

Figures

Fig. 1
Fig. 1
Performance of Barnes-Hut t-SNE implementation for cytometry data visualization. Standard (1000 iterations) and extended (3000 iterations) embeddings of mass cytometry (a) or flow cytometry (b) data are presented as heatmap density plots (left) or color-coded population overlays based on ground-truth classification of single cell in the datasets (right). c KLD change over iteration time of gradient descent for standard 1000 iterations (red line) or extended 3000 iterations (black line) embeddings of mass41parmeter dataset. Representative examples of multiple runs with varying seed values are shown
Fig. 2
Fig. 2
Effect of EE plateau phase on t-SNE visualization. EE was stopped after varying number of iterations and embedding visualization was examined at several intermediate timepoints and in the end of embedding for flow cytometry (total of 2000 iterations), (a) and mass cytometry (total of 3000 iterations). b Graphs showing KLD change over iteration time are color-labeled to distinguish curves corresponding to experiment perturbations, with black line indicating the run with the shortest EE but uninterrupted plateau. t-SNE maps are annotated with color-coded population overlays based on ground-truth classification of single cell in the datasets. c KLD and KLD relative change plotted against iteration time for the mass41parameter embedding. All embeddings were generated with standard BH-tSNE implementation and representative examples of multiple runs with varying seed values are shown
Fig. 3
Fig. 3
Effects of perplexity and EE factor adjustments on t-SNE visualization of cytometry data. a, b KLD, KLDRC, and t-SNE biaxial plots generated with varying EE factor values. c, d KLD, KLDRC, and t-SNE biaxial plots generated with varying perplexity. Graphs showing KLD and KLDRC change over iteration time are color-labeled to distinguish curves corresponding to experiment perturbations. Color overlays on t-SNE plots correspond to cell type classes labeled as in Figs. 1, 2. Representative examples of multiple runs with varying seed values are shown
Fig. 4
Fig. 4
Learning step size optimization for t-SNE visualization of large datasets. ac KLD change over iterations for embeddings with varying values of initial learning rate step size, color coded as indicated. a EE = 1000 iterations, learning rate step = 25–4000; b EE = 1000 iterations, learning rate step = 8000–2,048,000; c EE = 100–1000 iterations, learning rate step = 2000–512,000. d Representative t-SNE plots of embeddings graphed on a. e t-SNE plot of an optimized embedding. All color overlays on t-SNE plots correspond to cell type classes labeled as in Figs. 1, 2. Representative examples of multiple runs with varying seed values are shown
Fig. 5
Fig. 5
Evaluation of opt-SNE embeddings. a Endpoint KLD values for standard t-SNE (initial learning rate step = 200, EE stop = 250 iterations) and opt-SNE (initial learning rate = n/α, EE stop at maxKLDRC iteration). N = 5 seeds used for random initialization; error bars denote SEM. b Post-EE graph of KLD minimization over physical time for standard t-SNE, adjusted parameter (as indicated) t-SNE and opt-SNE (representative examples of mass cytometry data embeddings are shown). c 1NN accuracy scores for standard t-SNE and opt-SNE embeddings of of mass cytometry (left) and flow cytometry (right) data per assigned class values (cell subsets, open circles; overal scores, filled circles). Representative examples of multiple runs initiated with varying seed values are shown
Fig. 6
Fig. 6
opt-SNE allows high-quality visualization of large cytometry and transcriptomics datasets. ad 20 million datapoints from fluorescent cytometry dataset concatenated from 27 subjects vizualized in 2D space. a, c Cell type classes and density overlaid on 2D opt-SNE embedding. b Subject identifier overlaid on 2D opt-SNE embedding. Dashed arrows indicate clusters represented by datapoints from a single subject. d Standard t-SNE visualization (4000 iterations). e, f 10x Genomics mouse brain scRNA-seq dataset (1.3 million datapoints) visualized in 2D space with opt-SNE (e) or standard t-SNE (f). From left to right: density features, single gene classes, and Louvain clusters (0–38) overlays. g 5.22 million datapoints from mass cytometry dataset used in van Unen et al (2017) visualized in 2D space with opt-SNE. From left to right: CD4 expression overlaid on opt-SNE embedding; CCR7 and CD28 expression overlaid on CD4+ opt-SNE cluster; CD45RA and CD56 expression intensity overlaid on CD4+CD28CCR7 cluster. h CD4+CD28CCR7 cells from control, celiac disease (CeD), refractory celiac disease (RCeD) and Crohn’s disease (CrohnD) subjects presented on density plots. Dashed encirclements indicate CD45RA+ and CD56+ areas of the cluster as defined in g. i Hierarchical t-SNE (HSNE) embedding of the CD4 (left) and CD4+CD28 cluster (right) reproduced from van Unen et al. (licensed under a Creative Commons Attribution 4.0; http://creativecommons.org/licenses/by/4.0/). Color indicates marker expression intensity

References

    1. van der Maaten L, Hinton G. Visualizing data using t-SNE. J. Mach. Learn. Res. 2008;9:85.
    1. van der Maaten L. Accelerating t-SNE using tree-based algorithms. J. Mach. Learn. Res. 2014;15:3221–3245.
    1. Amir el AD, et al. viSNE enables visualization of high dimensional single-cell data and reveals phenotypic heterogeneity of leukemia. Nat. Biotechnol. 2013;31:545–552. doi: 10.1038/nbt.2594. - DOI - PMC - PubMed
    1. Wong MT, et al. Mapping the diversity of follicular helper t cells in human blood and tonsils using high-dimensional mass cytometry analysis. Cell Rep. 2015;11:1822–1833. doi: 10.1016/j.celrep.2015.05.022. - DOI - PubMed
    1. Becher B, et al. High-dimensional analysis of the murine myeloid cell system. Nat. Immunol. 2014;15:1181–1189. doi: 10.1038/ni.3006. - DOI - PubMed