. 2019 Nov 28;9(1):17870.
doi: 10.1038/s41598-019-54281-0.

Variations in microbial community structure and functional gene expression in bio-treatment processes with odorous pollutants

Affiliations

Variations in microbial community structure and functional gene expression in bio-treatment processes with odorous pollutants

Weidong Li et al. Sci Rep. .

Abstract

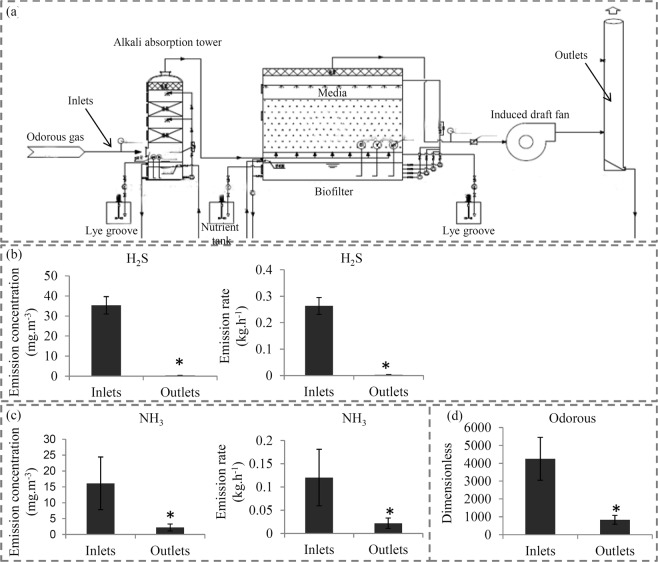
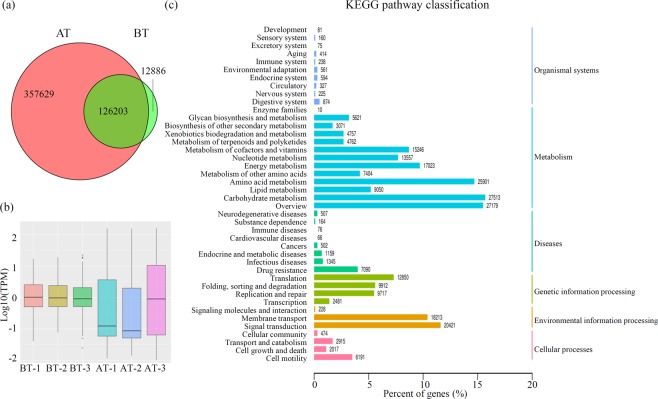
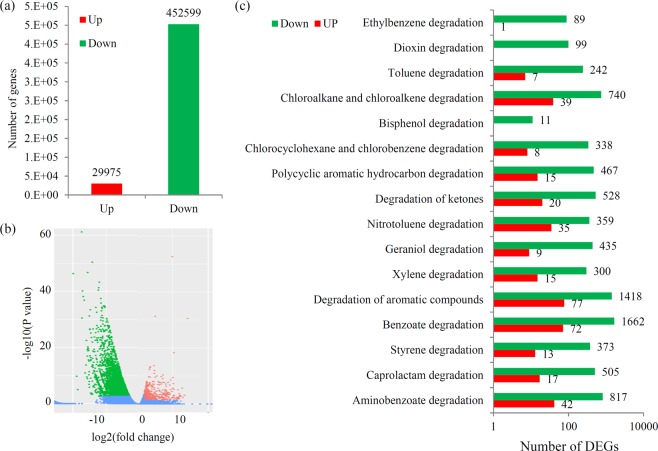
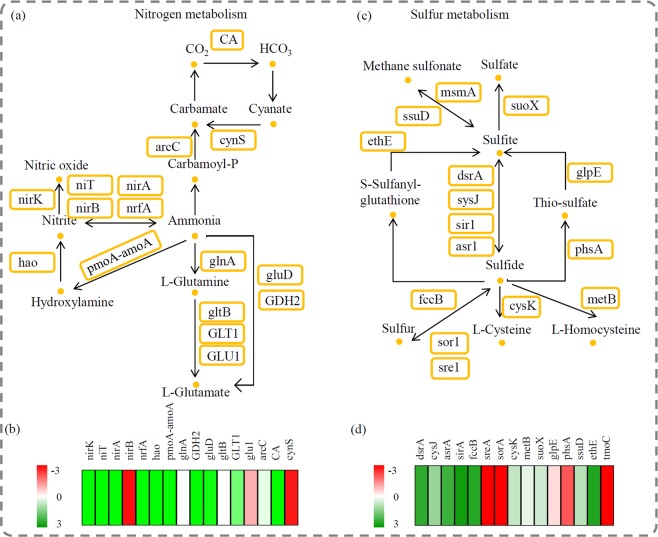
Engineered microbial ecosystems in biofilters have been widely applied to treat odorous gases from industrial emissions. Variations in microbial community structure and function associated with the removal of odorous gases by biofilters are largely unknown. This study performed a metagenomic analysis to discover shifts in microbial community structures in a commercial scale biofilter after treating odorous gas. Our study identified 175,675 functional genes assigned into 43 functional KEGG pathways. Based on the unigene sequences, there were significant changes in microbial community structures in the biofilter after treating odorous gas. The dominant genera were Thiobacillus and Oceanicaulis before the treatment, and were Acidithiobacillus and Ferroplasma after the treatment. A clustering analysis showed that the number of down-regulated microbes exceeded the number of up-regulated microbes, suggesting that odorous gas treatment reduced in microbial community structures. A differential expression analysis identified 29,975 up- and 452,599 down-regulated genes. An enrichment analysis showed 17 classic types of xenobiotic biodegradation pathways. The results identified 16 and 15 genes involved in ammonia and sulfite metabolism, respectively; an analysis of their relative abundance identified several up-regulated genes, which may be efficient genes involved in removing odorous gases. The data provided in this study demonstrate the changes in microbial communities and help identify the dominant microflora and genes that play key roles in treating odorous gases.


Conflict of interest statement

The authors declare no competing interests.

Figures

Figure 1
Figure 1
Removal performance for odorous gases of our biofilter construction. (a) A sketch map showed the details of the biofilter construction in our study. (b) The emission concentrations and emission rates of H2S in the inlet and outlet of the biofilter construction. (c) The emission concentrations and emission rates of NH3 in the inlet and outlet of the biofilter construction. (d) The dimensionless of odorous gases in the inlet and outlet of the biofilter construction. The significant variations (p < 0.05between the inlet and outlet were indicated by “*”. Error bars represent mean ± SD (n = 3).
Figure 2
Figure 2
Overview of the metagenomes. (a) The numbers of unigene identified in the BT and AT sample groups are shown in a Venn diagram. Red indicated the unigenes in the AT sample group and green indicated the unigenes in the BT sample group. (b) The box-plot analysis showed that ranges of the expression abundances of unigenes from both of the BT and AT sample groups. (c) The KEGG functional prediction and classification of all identified unigenes.
Figure 3
Figure 3
Comparative taxonomic profile of BT and AT metagenomes. (a) Microbial compositions for both BT and AT sample groups at genus level. Color intensity in each panel shows the relative abundances of each representative species in the BT and AT sample groups. (b) Microbial compositions for both BT and AT sample groups at phylum level. The scale unit of the heatmap is RPKM (Reads Per Kilobase per Million mapped reads). The heatmap scale ranges from −10 to +10 on a log2 (RPKM).
Figure 4
Figure 4
Analysis of differential expressed genes (DEGs). (a) The number of up- and down-regulated genes after treatment. (b) Significance analysis of the DEGs between the AT and BT sample groups by Volcanoplot. (c) The number of up- and down-regulated genes related to xenobiotic biodegradation pathways after treatment.
Figure 5
Figure 5
Analysis of the genes involved in the nitrogen metabolic and sulfur metabolic pathways. (a) Overview of the nitrogen metabolic pathway. (b) The relative abundances of the genes involved in the nitrogen metabolic pathway. (b) Overview of the sulfur metabolic pathway. (b) The relative abundances of the genes involved in the sulfur metabolic pathway. Red indicated up-regulated and green indicated down-regulated genes. The heatmap scale ranges from −3 to +3 on a log2 scale.

References

    1. Wu C, et al. Microbial compositions and metabolic interactions in one- and two-phase partitioning airlift bioreactors treating a complex VOC mixture. J Ind Microbiol Biotechnol. 2017;44:1313–1324. doi: 10.1007/s10295-017-1955-7. - DOI - PubMed
    1. Balasubramanian P, Philip L, Murty Bhallamudi S. Biotrickling filtration of complex pharmaceutical VOC emissions along with chloroform. Bioresour Technol. 2012;114:149–159. doi: 10.1016/j.biortech.2012.03.035. - DOI - PubMed
    1. Lim JH, Cha JS, Kong BJ, Baek SH. Characterization of odorous gases at landfill site and in surrounding areas. Journal of Environmental Management. 2018;206:291–303. doi: 10.1016/j.jenvman.2017.10.045. - DOI - PubMed
    1. Yuan H, Du X, Tai H, Xu M. Temperature-programmed multicapillary gas chromatograph microcolumn for the analysis of odorous sulfur pollutants. J Sep Sci. 2018;41:893–898. doi: 10.1002/jssc.201700792. - DOI - PubMed
    1. Wu H, et al. Recent progress and perspectives in biotrickling filters for VOCs and odorous gases treatment. J Environ Manage. 2018;222:409–419. doi: 10.1016/j.jenvman.2018.06.001. - DOI - PubMed

Publication types

MeSH terms