

Crude Oil Sensing using Carbon Nano Structures Synthetized from Phoenix Dactylifera L. Cellulose
- PMID: 31780811
- PMCID: PMC6882808
- DOI: 10.1038/s41598-019-54417-2
Crude Oil Sensing using Carbon Nano Structures Synthetized from Phoenix Dactylifera L. Cellulose
Abstract
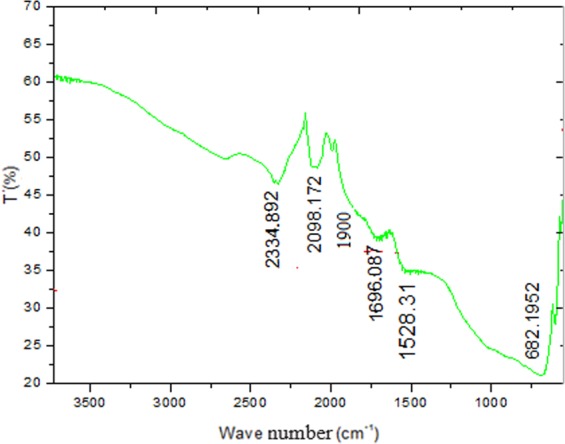
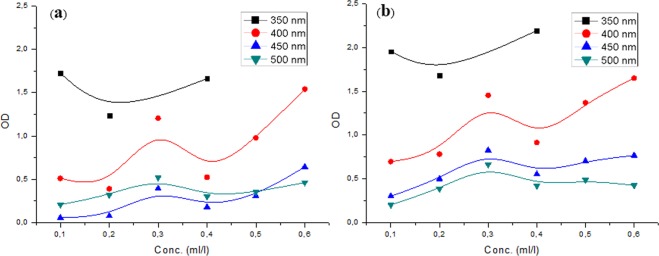
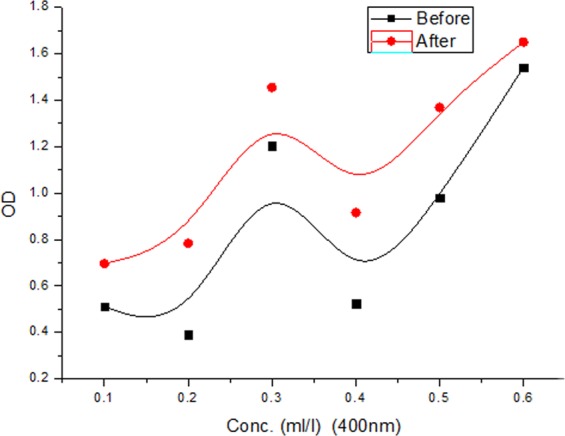
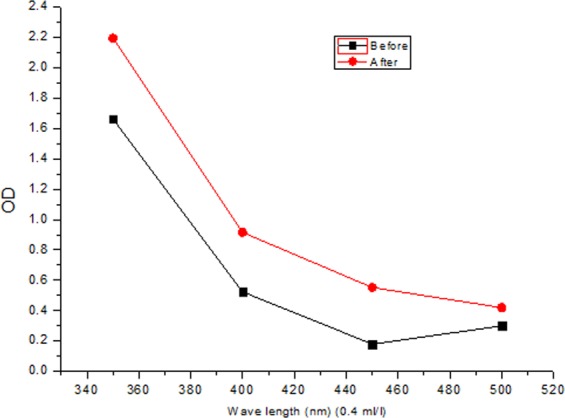
This study reports on the crude oil-sensing using carbon nano structures (CNSs). A mixture of CNSs was obtained by a simple method of preparation using palm cellulose ash and nitric acid as precursors, the powder was characterized by x-ray diffraction and infrared spectroscopy. The optical density of crude oil from Rhoud El-Baguel area (Southeast of Algeria) studied using UV-Vis spectroscopy, before and after adding an amount of CNSs powder to view the CNSs crude oil sensing and therefore a new method to determine the quality of crude oils and the comparison between them. Results show that CNSs prepared from palm cellulose ash have a good crystallinity and it is formed mainly from carbon nano dots (CNDs) with 4.32 Å in layers spacing and 7.4 Å in crystallite size, indicate that CNSs can be used as an excellent crude oil sensor.
Conflict of interest statement
The authors declare no competing interests.
Figures


Similar articles
-
Biowaste Valorization of Palm Tree Phoenix dactylifera L. for Nanocellulose Production.IET Nanobiotechnol. 2024 May 27;2024:7867463. doi: 10.1049/2024/7867463. eCollection 2024. IET Nanobiotechnol. 2024. PMID: 38938743 Free PMC article.
-
Production and characterization of bacterial cellulose synthesized by Enterobacter chuandaensis strain AEC using Phoenix dactylifera and Musa acuminata.Arch Microbiol. 2024 Oct 29;206(11):447. doi: 10.1007/s00203-024-04182-2. Arch Microbiol. 2024. PMID: 39470811
-
Production and analysis of synthesized bacterial cellulose by Enterococcus faecalis strain AEF using Phoenix dactylifera and Musa acuminata fruit extracts.World J Microbiol Biotechnol. 2024 Oct 24;40(11):362. doi: 10.1007/s11274-024-04159-9. World J Microbiol Biotechnol. 2024. PMID: 39446188
-
Carbon Nanosheets: Synthesis and Application.ChemSusChem. 2015 Jun 22;8(12):2004-27. doi: 10.1002/cssc.201500141. Epub 2015 Jun 3. ChemSusChem. 2015. PMID: 26036331 Review.
-
Effect of Pollen, Pit Powder, and Gemmule Extract of Date Palm on Male Infertility: A Systematic Review.J Am Coll Nutr. 2018 Feb;37(2):154-160. doi: 10.1080/07315724.2017.1364183. Epub 2017 Oct 31. J Am Coll Nutr. 2018. PMID: 29087245
Cited by
-
Experience of virtual commissioning of a process control system for the production of high-paraffin oil.Sci Rep. 2022 Nov 1;12(1):18415. doi: 10.1038/s41598-022-21778-0. Sci Rep. 2022. PMID: 36319801 Free PMC article.
-
Effect of Leaf Powdering Technique on the Characteristics of Date Palm-Derived Cellulose.ACS Omega. 2023 May 19;8(21):18930-18939. doi: 10.1021/acsomega.3c01222. eCollection 2023 May 30. ACS Omega. 2023. PMID: 37273633 Free PMC article.
References
-
- Ellingsen G, Fery-Forgues S. Application de la spectroscopie de fluorescence à l'étude du pétrole: le défi de la complexité. Revue de l’Institut Français du Pétrole. 1998;53(2):201–216. doi: 10.2516/ogst:1998019. - DOI
-
- Taylor TA, Patterson HH. Excitation resolved synchronous fluorescence analysis of aromatic compounds and fuel oil. Analytical chemistry. 1987;59(17):2180–2187. doi: 10.1021/ac00144a037. - DOI
Publication types
MeSH terms
Substances
LinkOut - more resources
Full Text Sources
Other Literature Sources
Research Materials
Miscellaneous
