. 2019 Dec;16(12):1254-1261.
doi: 10.1038/s41592-019-0658-6. Epub 2019 Nov 28.

Analysis of the Human Protein Atlas Image Classification competition

Affiliations

Analysis of the Human Protein Atlas Image Classification competition

Wei Ouyang et al. Nat Methods. 2019 Dec.

Erratum in

  • Publisher Correction: Analysis of the Human Protein Atlas Image Classification competition.
    Ouyang W, Winsnes CF, Hjelmare M, Cesnik AJ, Åkesson L, Xu H, Sullivan DP, Dai S, Lan J, Jinmo P, Galib SM, Henkel C, Hwang K, Poplavskiy D, Tunguz B, Wolfinger RD, Gu Y, Li C, Xie J, Buslov D, Fironov S, Kiselev A, Panchenko D, Cao X, Wei R, Wu Y, Zhu X, Tseng KL, Gao Z, Ju C, Yi X, Zheng H, Kappel C, Lundberg E. Ouyang W, et al. Nat Methods. 2020 Jan;17(1):115. doi: 10.1038/s41592-019-0699-x. Nat Methods. 2020. PMID: 31822866
  • Publisher Correction: Analysis of the Human Protein Atlas Image Classification competition.
    Ouyang W, Winsnes CF, Hjelmare M, Cesnik AJ, Åkesson L, Xu H, Sullivan DP, Dai S, Lan J, Jinmo P, Galib SM, Henkel C, Hwang K, Poplavskiy D, Tunguz B, Wolfinger RD, Gu Y, Li C, Xie J, Buslov D, Fironov S, Kiselev A, Panchenko D, Cao X, Wei R, Wu Y, Zhu X, Tseng KL, Gao Z, Ju C, Yi X, Zheng H, Kappel C, Lundberg E. Ouyang W, et al. Nat Methods. 2020 Feb;17(2):241. doi: 10.1038/s41592-020-0734-y. Nat Methods. 2020. PMID: 31969731 Free PMC article.
  • Author Correction: Analysis of the Human Protein Atlas Image Classification competition.
    Ouyang W, Winsnes CF, Hjelmare M, Cesnik AJ, Åkesson L, Xu H, Sullivan DP, Dai S, Lan J, Jinmo P, Galib SM, Henkel C, Hwang K, Poplavskiy D, Tunguz B, Wolfinger RD, Gu Y, Li C, Xie J, Buslov D, Fironov S, Kiselev A, Panchenko D, Cao X, Wei R, Wu Y, Zhu X, Tseng KL, Gao Z, Ju C, Yi X, Zheng H, Kappel C, Lundberg E. Ouyang W, et al. Nat Methods. 2020 Sep;17(9):948. doi: 10.1038/s41592-020-0937-2. Nat Methods. 2020. PMID: 32760039 Free PMC article.

Abstract

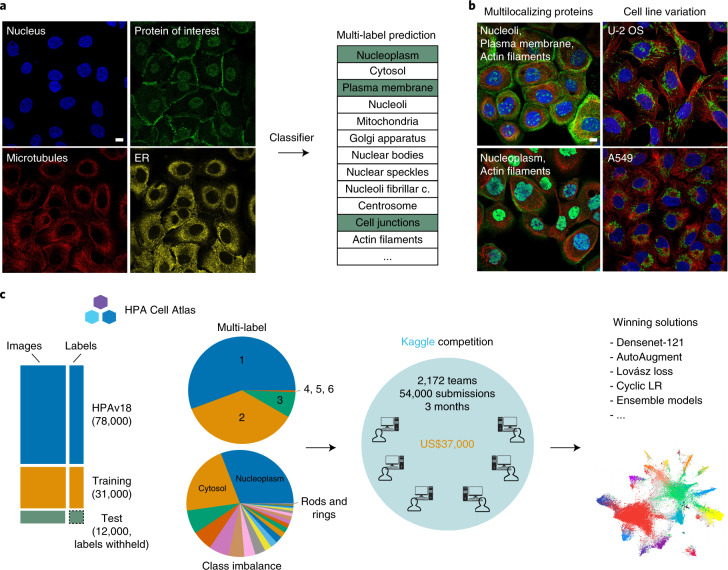
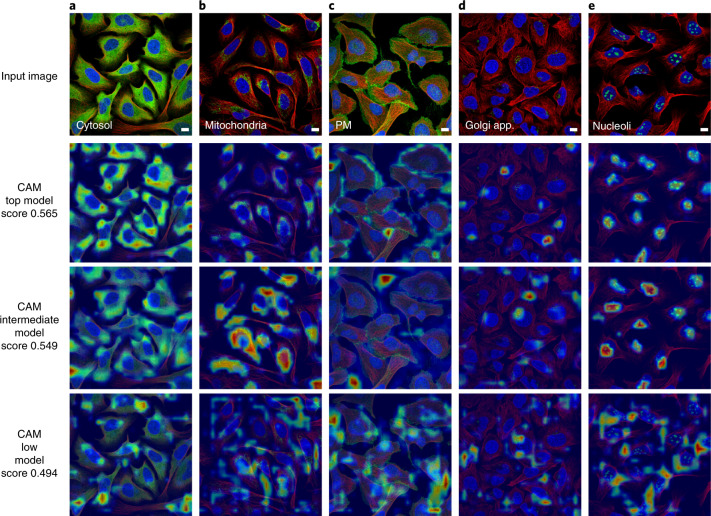
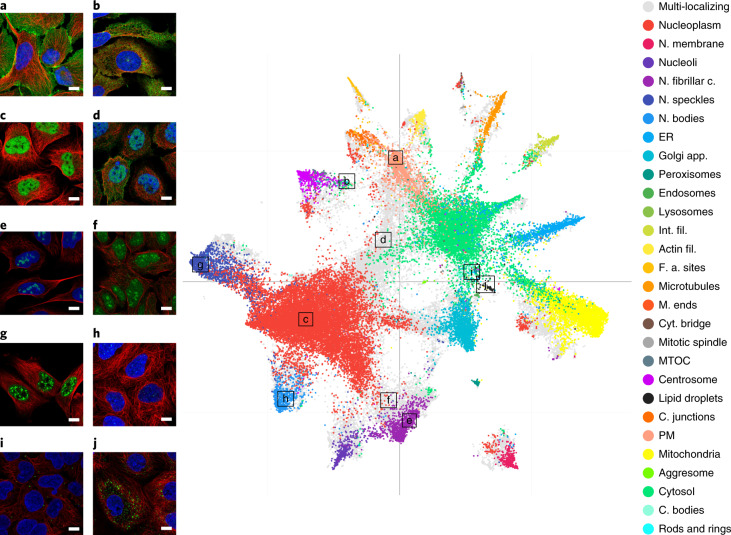
Pinpointing subcellular protein localizations from microscopy images is easy to the trained eye, but challenging to automate. Based on the Human Protein Atlas image collection, we held a competition to identify deep learning solutions to solve this task. Challenges included training on highly imbalanced classes and predicting multiple labels per image. Over 3 months, 2,172 teams participated. Despite convergence on popular networks and training techniques, there was considerable variety among the solutions. Participants applied strategies for modifying neural networks and loss functions, augmenting data and using pretrained networks. The winning models far outperformed our previous effort at multi-label classification of protein localization patterns by ~20%. These models can be used as classifiers to annotate new images, feature extractors to measure pattern similarity or pretrained networks for a wide range of biological applications.


Conflict of interest statement

The authors declare no competing interests.

Figures

Fig. 1
Fig. 1. Overview of image dataset and challenge design.
a, A typical HPA Cell Atlas image and the aim of the competition. Each image consists of four channels: the antibody-stained protein of interest (green) and three reference channels to outline the cell: microtubules (red), nucleus (blue) and endoplasmic reticulum (ER; yellow). The human cell comprises many compartments, here defined by 28 labels. The aim of the competition is to build classifiers to predict the localization pattern (often multiple labels) of the protein of interest. Scale bar, 10 μm. b, Sample images showing different protein or cell line expression patterns that make the pattern classification task challenging. Proteins localizing to multiple compartments are exemplified by Septin 7 in A-431 cells (left, top), and PRAME family member 12 in A-431 cells (left, bottom). Stainings of mitochondria (TOMM70, Translocase of outer mitochondrial membrane 70, in U-2 OS and CCR7, C-C motif chemokine receptor 7, in A459) show the morphological differences between cell lines (right, from top to bottom). Scale bar, 10 μm. PM, plasma membrane; Actin fil., actin filaments. c, Challenge overview: the HPA is a proteome-wide image collection detailing protein localization. This dataset is challenging to analyze automatically because of prevalent multi-label classifications (1–6 labels per image, upper pie chart) and high imbalance among the 28 different protein localization classes (lower pie chart). To find the best solution for these problems, we held a competition hosted by Kaggle. The challenge dataset consisted of 42,774 images with labels from expert annotations and was divided into a training set and test set before distributed to the Kaggle challenge participants with the labels of the test set withheld. We used a macro F1 score to assess the performance of these models. The competition produced winning solutions and different methods for multi-label image classification. LR, learning rate.
Fig. 2
Fig. 2. Competition results.
a, Image numbers of each localization class for HPAv18, training, validation_public and test_private dataset. PM, plasma membrane; Golgi app., Golgi apparatus; N. bodies, nuclear bodies; N. speckles, nuclear speckles; N. fibrillar c., nucleolar fibrillar center; ER, endoplasmic reticulum; N. membrane, nuclear membrane; C. junctions, cell junctions; Int. fil., intermediate filaments; Actin fil., actin filaments; MTOC, microtubule organizing center; F. a. sites, focal adhesion sites; Cyt. bridge, cytokinetic bridge; C. bodies, cytoplasmic bodies; M. ends, mitochondrial ends. b, Precision-recall values for the experts, selected teams (including the top four winning teams) and all other teams. c, Statistics on the macro F1 scores of different teams and their performance on different classes. Score distributions for the different label classes with the classes sorted according to sample size (high to the left, low to the right). n = 10 teams for each violin. The minimum (min), mean, percentile (P) and maximum (max) values can be found in Supplementary Table 9. d, Statistics on the macro F1 scores of different teams and their performance, binned into groups based on their ranking on the leaderboard. The top 10, 11–100, 101–500 and the remaining teams, respectively. The scores for single localized, multi-localized and all proteins are shown separately. n = 10 teams for violins with teams 1–10, n = 90 teams for violins with teams 11–100, n = 400 teams for violins with teams 101–500 and n = 1,637 teams for violins with teams 501–2,137. The minimum, mean, percentile and maximum values can be found in Supplementary Table 9.
Fig. 3
Fig. 3. Visualization of model spatial attention.
CAMs for three different models, the top-scoring model (from Team 1), an intermediate-scoring model (from Team 3) and a low-scoring model (from Team 1). Scale bars, 10 μm. a, For the cytosolic protein Methenyltetrahydrofolate synthetase, the CAMs for all three models highlight relevant cellular regions. b, The CAMs for the mitochondrial protein Prohibitin 2 show a progressively worse overlap with the mitochondrial staining following the model accuracy score. c, The plasma membrane staining of Catenin beta 1 overlaps well with the CAM for the top model, but not for the intermediate and lower scoring models. d, The CAMs for Golgi reassembly stacking protein 1, which is localized to the Golgi apparatus, show attention of correct size for all three models, but none of the models focused on all cells in the image. e, The nucleolar staining pattern of UTP6 small subunit processome component, is captured well by the CAMs for the top and intermediate models in the nuclear region of the cell.
Fig. 4
Fig. 4. Visualization of learned features.
UMAP visualization of the features learned by the best scoring model from Team 1 with a few corresponding original images highlighted. Single location images are colored according to location, while gray data points belong to multi-localizing proteins. Abbreviations as in Fig. 2. Scale bars, 10 μm. a, Catenin beta 1 is localized to the plasma membrane and also appears in the plasma membrane protein cluster. b, Although trained on the manual labels, this type of unbiased analysis provides a tool to identify misclassified patterns or subtle pattern variations. The protein suppressor of cytokine signaling 3 with the label ‘cytosol’ is found among the centrosome/microtubule organizing center (MTOC) cluster. After visual inspection, we can indeed identify an enrichment of this protein around the MTOC in addition to the cytoplasm in some cells. c, RUNX1 translocation partner 1 is localized to the nucleoplasm and appears in the nucleoplasmic protein cluster. d, Utrophin is localized to both the plasma membrane and nucleoplasm and appears between these two respective clusters. e, EBNA1 binding protein 2 is localized to nucleoli and appears in the nucleoli cluster. f, L3MBTL3 histone methyl-lysine binding protein is localized to both the nucleoli and nucleus, and appears between these two respective clusters. g,h, Heterochromatin protein 1 binding protein 3 is localized to nuclear speckles (g) and Centromere protein T (h) is localized to centromeres. Despite the pattern similarities of the two categories, they still appear in two distinct clusters. i,j, Enhancer of mRNA decapping 4 protein is localized to cytoplasmic bodies (i), generating a similar staining pattern as Perilipin 3, which is localized to lipid droplets (j). Despite the similarities of the two categories, they still appear in two distinct clusters.

References

    1. Ouyang W, Zimmer C. The imaging tsunami: computational opportunities and challenges. Curr. Opin. Syst. Biol. 2017;4:105–113. doi: 10.1016/j.coisb.2017.07.011. - DOI
    1. Uhlén M, et al. Tissue-based map of the human proteome. Science. 2015;347:1260419. doi: 10.1126/science.1260419. - DOI - PubMed
    1. Thul PJ, et al. A subcellular map of the human proteome. Science. 2017;356:eaal3321. doi: 10.1126/science.aal3321. - DOI - PubMed
    1. Mahdessian, D. et al. Spatiotemporal dissection of the cell cycle regulated human proteome. Preprint at bioRxiv10.1101/543231 (2019).
    1. Sullivan DP, et al. Deep learning is combined with massive-scale citizen science to improve large-scale image classification. Nat. Biotechnol. 2018;36:820–828. doi: 10.1038/nbt.4225. - DOI - PubMed

Publication types