

Comparing Ocular Responses to Caloric Irrigation and Electrical Vestibular Stimulation in Vestibular Schwannoma
- PMID: 31781023
- PMCID: PMC6857726
- DOI: 10.3389/fneur.2019.01181
Comparing Ocular Responses to Caloric Irrigation and Electrical Vestibular Stimulation in Vestibular Schwannoma
Abstract
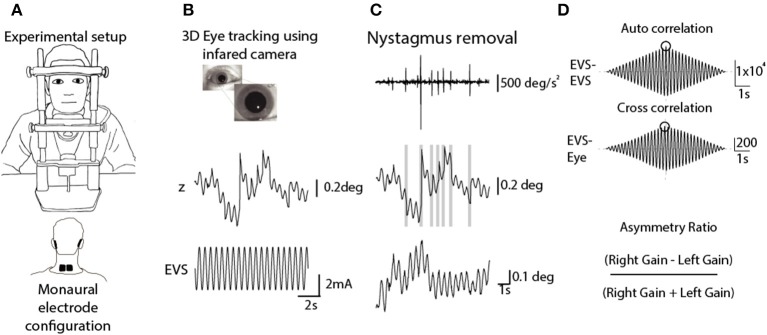
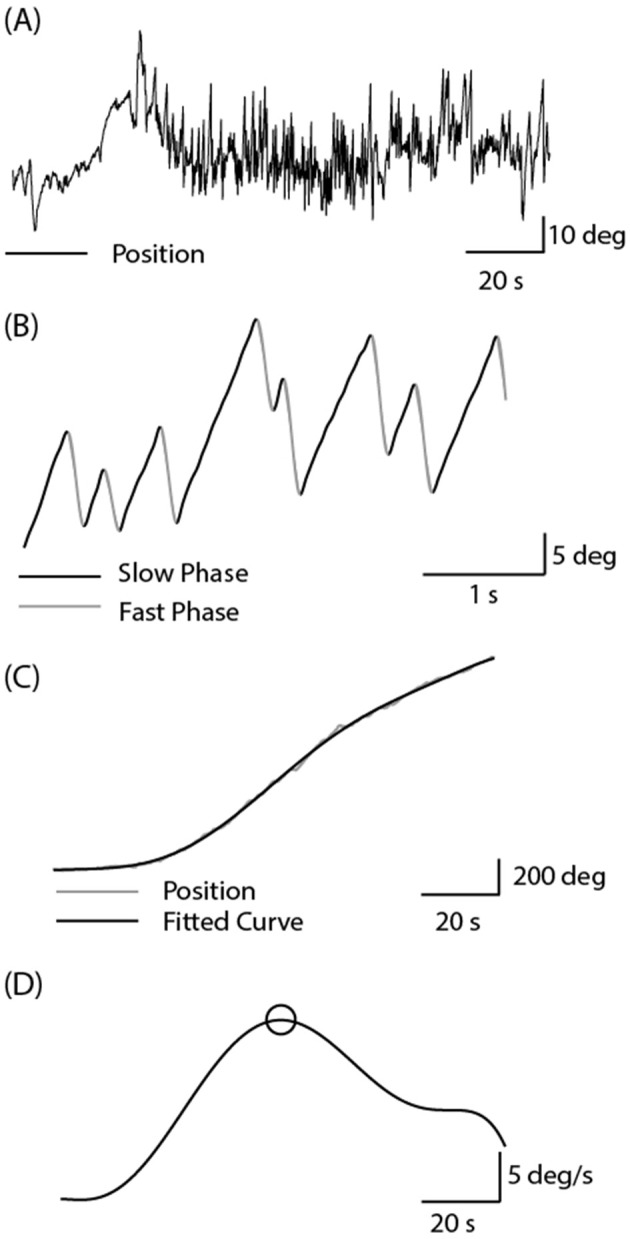
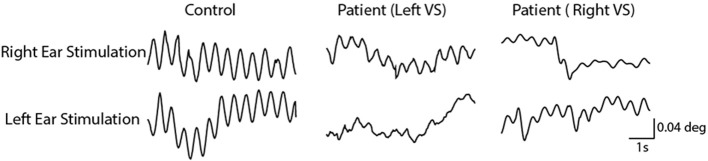
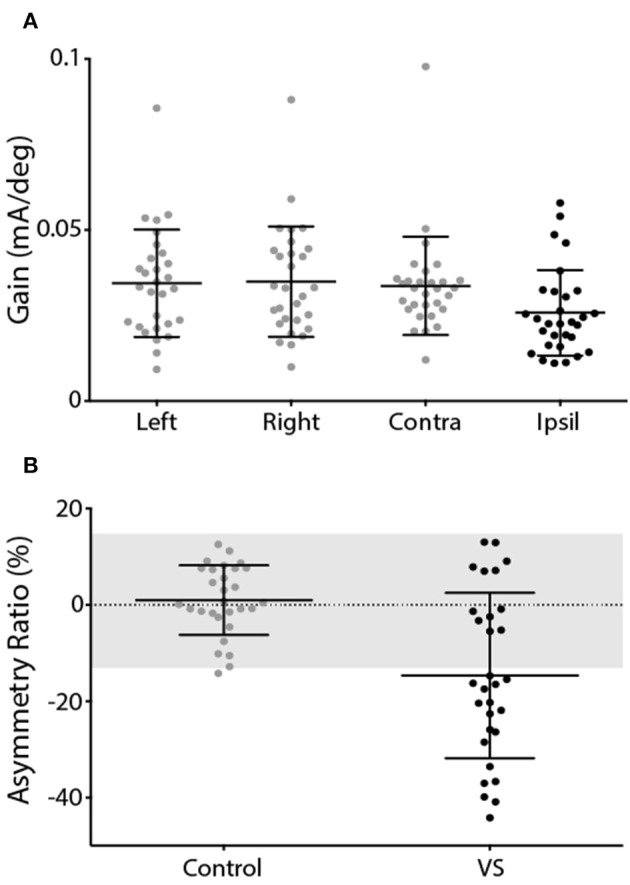
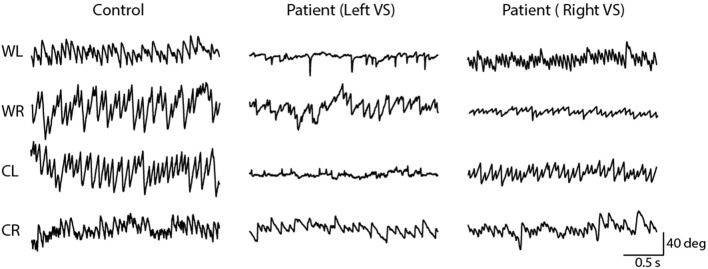
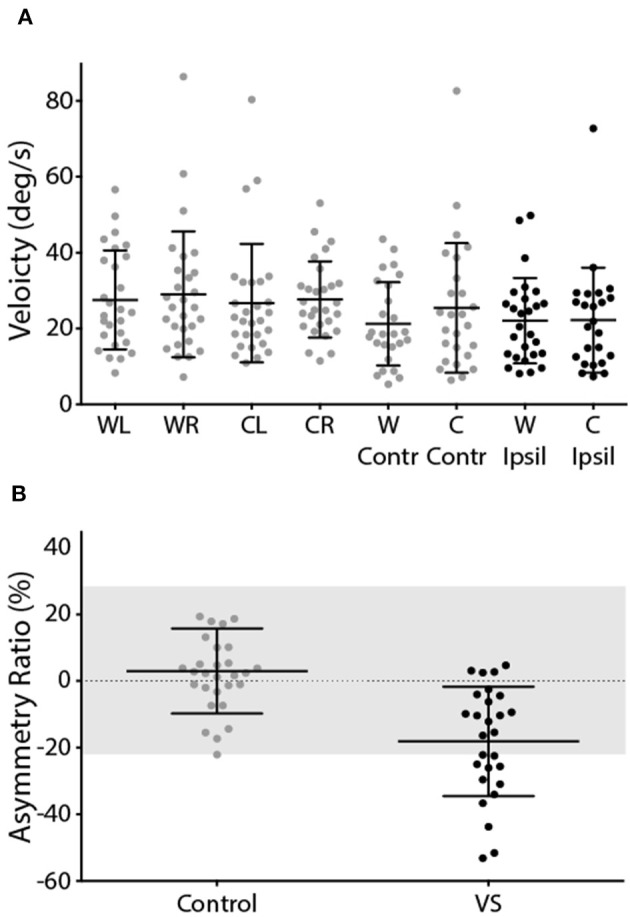
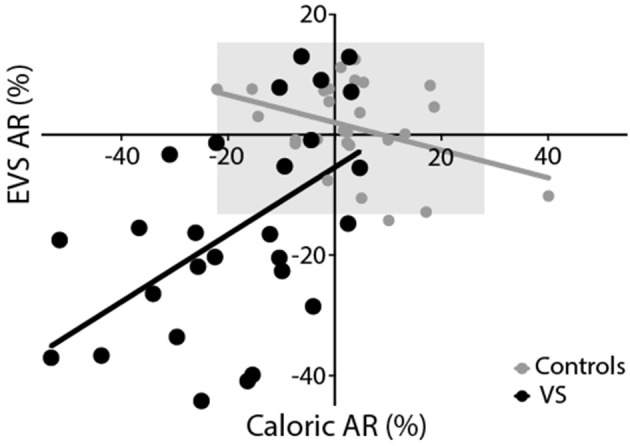
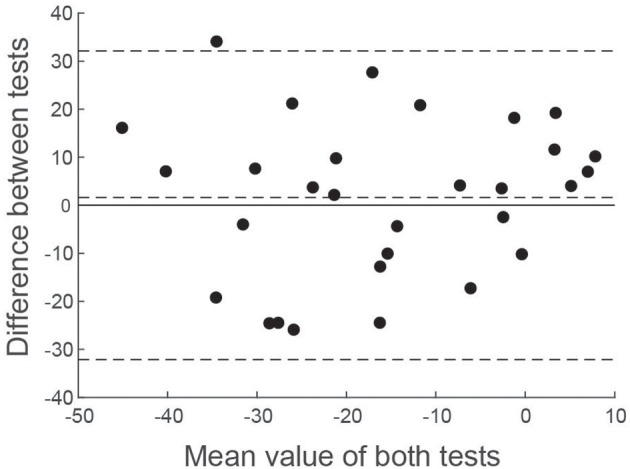
Electrical Vestibular Stimulation (EVS) is a non-invasive technique for activating the vestibular-ocular reflex, evoking mainly a torsional eye movement response. We have previously demonstrated that this response can be used to detect vestibular asymmetry in patients with vestibular schwannoma (VS). Here we perform a direct comparison of EVS with caloric irrigation in this patient group. We studied 30 patients with unilateral VS, alongside an equal number of aged-matched healthy control subjects. EVS current was delivered to the mastoid process in a monaural configuration using a sinusoidal stimulus (2 Hz; ± 2 mA; 10 s), with an electrode placed over the spinous C7 process. Evoked eye movements were recorded from the right eye in darkness using an infra-red sensitive camera while the subject sat relaxed with their head on a chinrest. Ocular torsion was subsequently tracked off-line using iris striations. Each subject separately underwent water caloric irrigation, in accordance with the British Society of Audiology guidelines. For the caloric test, eye movement was recorded in the yaw axis using electro-oculography. For both EVS and calorics, inter-aural response asymmetry was calculated to determine the extent of canal paresis. Both tests revealed impaired vestibular function in the ipsilesional ear of VS patients, with a mean asymmetry ratio of 15 ± 17% and 18 ± 16% for EVS and calorics, respectively. Overall, the caloric test results discriminated controls from patients slightly more effectively than EVS (Cohen's D effect size = 1.44 vs. 1.19). Importantly, there was a significant moderate correlation between the AR values produced by EVS and calorics (r = 0.53, p < 0.01), and no significant difference between mean AR estimates. When questioned, ≥85% of participants subjectively preferred the EVS experience, in terms of comfort. Moreover, it took ~15 min to complete, vs. ~1 h for caloric. These results confirm that the results of the EVS test broadly agree with those of caloric irrigation, in terms of detecting vestibular asymmetry. Furthermore, they suggest a higher degree of convenience and patient comfort.
Keywords: asymmetry ratio; caloric irrigation; electrical vestibular stimulation; ocular torsion; vestibular schwannoma.
Copyright © 2019 Mackenzie, Iriving, Monksfield, Dezso, Dawe, Lindley and Reynolds.
Figures
Similar articles
-
Ocular torsion responses to electrical vestibular stimulation in vestibular schwannoma.Clin Neurophysiol. 2018 Nov;129(11):2350-2360. doi: 10.1016/j.clinph.2018.08.023. Epub 2018 Sep 8. Clin Neurophysiol. 2018. PMID: 30248625 Free PMC article.
-
Ocular torsion responses to sinusoidal electrical vestibular stimulation.J Neurosci Methods. 2018 Jan 15;294:116-121. doi: 10.1016/j.jneumeth.2017.11.012. Epub 2017 Nov 21. J Neurosci Methods. 2018. PMID: 29170018 Free PMC article.
-
Three dimensional vestibular ocular reflex testing using a six degrees of freedom motion platform.J Vis Exp. 2013 May 23;(75):e4144. doi: 10.3791/4144. J Vis Exp. 2013. PMID: 23728158 Free PMC article.
-
Isolated vestibular nuclear infarction: report of two cases and review of the literature.J Neurol. 2014 Jan;261(1):121-9. doi: 10.1007/s00415-013-7139-0. Epub 2013 Oct 27. J Neurol. 2014. PMID: 24162036 Review.
-
Perspectives for the comprehensive examination of semicircular canal and otolith function.Biol Sci Space. 2001 Dec;15(4):393-400. doi: 10.2187/bss.15.393. Biol Sci Space. 2001. PMID: 12101365 Review.
Cited by
-
Applicability of Oculomotor Tests for Predicting Central Vestibular Disorder Using Principal Component Analysis.J Pers Med. 2022 Feb 2;12(2):203. doi: 10.3390/jpm12020203. J Pers Med. 2022. PMID: 35207691 Free PMC article.
References
-
- Enticott JC, Dowell RC, O'Leary SJ. A comparison of the monothermal and bithermal caloric tests. J Vestib Res. (2003) 13:113–9. - PubMed
-
- Hamid M, Hughes G, Kinney S. Criteria for diagnosing bilateral vestibular dysfunction. In: Graham M, Kemink J. editors. The Vestibular System: Neurophysiologic and Clinical Research. New York, NY: Raven Press; (1987). p. 115–8.
Grants and funding
LinkOut - more resources
Full Text Sources
Research Materials
Miscellaneous