

Microbiome and Metabolome Analyses of Milk From Dairy Cows With Subclinical Streptococcus agalactiae Mastitis-Potential Biomarkers
- PMID: 31781063
- PMCID: PMC6851174
- DOI: 10.3389/fmicb.2019.02547
Microbiome and Metabolome Analyses of Milk From Dairy Cows With Subclinical Streptococcus agalactiae Mastitis-Potential Biomarkers
Abstract
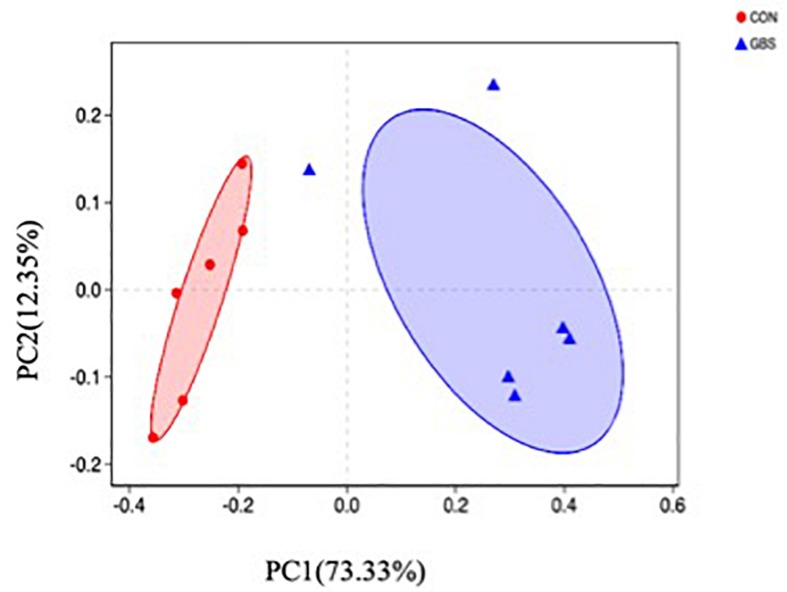
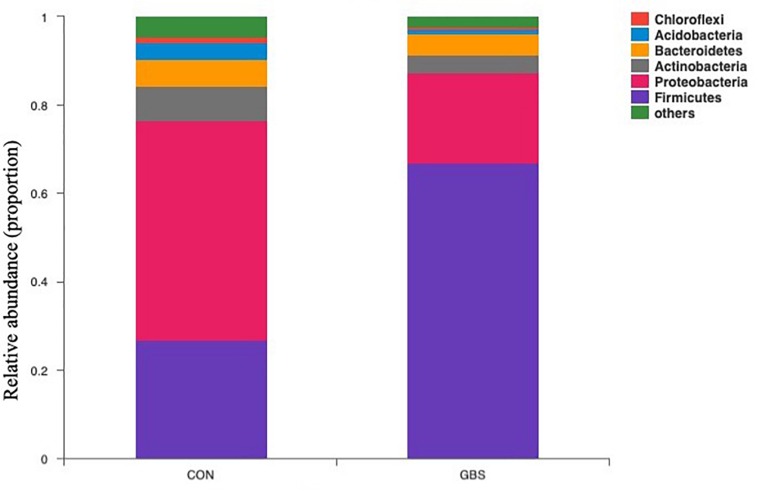
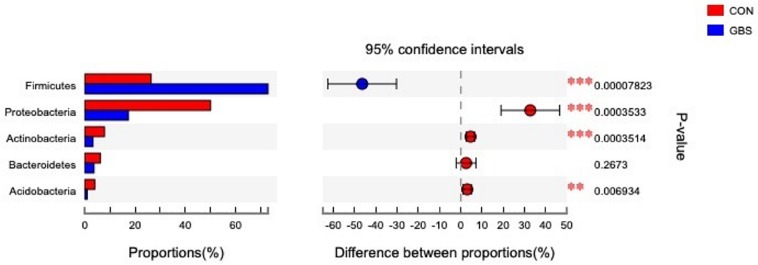
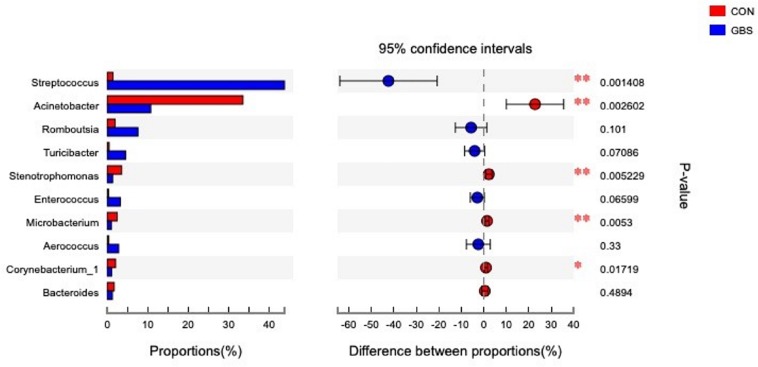
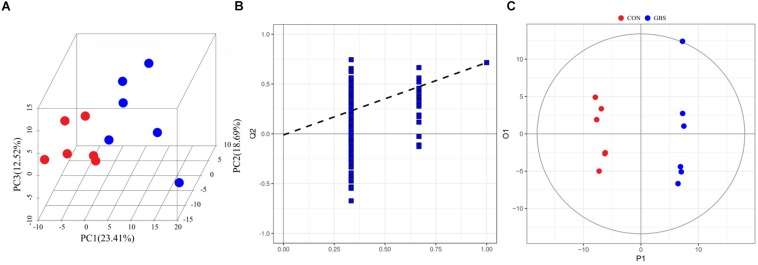
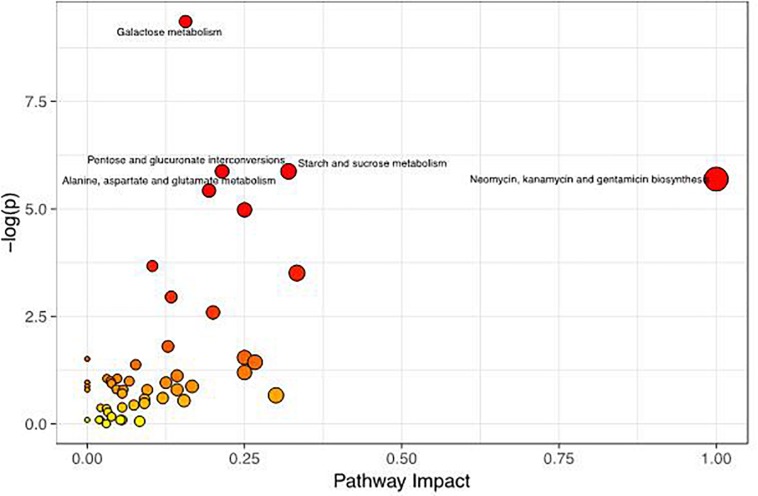
The microbial ecosystem in the udders of dairy cows directly influences the flavor and quality of milk. However, to our knowledge, no published research has analyzed the complex relationship between the udder microbiome and its associated metabolism in animals with subclinical mastitis. We identified the bacterial species and measured relative population numbers in the milk of cows with subclinical Streptococcus agalactiae mastitis (GBS) and compared this information to that from the milk of healthy cows. Metabolite profiles were determined to investigate correlations between the milk microbiota and metabolic factors in healthy vs. GBS dairy cows. Six milk samples from GBS cows and six from healthy cows were subjected to 16S rRNA gene sequencing to identify the microbial species using a MiSeq high-throughput sequencing apparatus. The metabolites present in the milk were identified by gas chromatography time-of-flight mass spectrometry. Both principal component analysis and orthogonal partial least squares discriminant analysis indicated that the metabolites were well-separated from each other in the milk samples from the two groups. GBS dramatically altered microbial diversity, and the GBS group had significantly fewer Proteobacteria, Actinobacteria, and Acidobacteria than the CON group, with greater relative abundance of Firmicutes (p < 0.01). Several bacterial genera, such as Streptococcus, were significantly more abundant in milk from the GBS group than in milk from the CON group, and there was a tendency for greater abundance of Turicibacter (p = 0.07) and Enterococcus spp. (p = 0.07) in the GBS group. The levels of five milk metabolites were significantly higher in the GBS group than in the CON group: phenylpyruvic acid, the homogentisic acid: 4-hydroxyphenylpyruvic acid ratio, the xanthine: guanine ratio, uridine and glycerol. Metabolic pathway analysis of the different metabolites revealed that the following were enriched in both groups: galactose metabolism; pentose and glucuronate interconversion; starch and sucrose metabolism; alanine, aspartate and glutamate metabolism; arginine biosynthesis; citrate cycle (TCA cycle); D-glutamine and D-glutamate metabolism; and the neomycin, kanamycin, and gentamicin biosynthesis pathways. Several typical metabolites were highly correlated with specific ruminal bacteria, such as Streptococcaceae, Lachnospiraceae, Lactobacillaceae and Corynebacteriaceae, demonstrating the functional correlations between the milk microbiome and associated metabolites. These findings revealed that the milk microbiota and metabolite profiles were significantly different between the two groups of cows, raising the question of whether the microbiota associated with the bovine mammary gland could be related to mammary gland health. There was also a relationship between milk quality and the presence of spoilage bacteria. Other bacterial taxa should be investigated, as related information may provide insights into how perturbations in milk metabolomics profiles relate to differences in milk synthesis between healthy cows and those with subclinical mastitis.
Keywords: Streptococcus agalactiae; dairy cows; mastitis; metabolomics; milk microbiome.
Copyright © 2019 Tong, Zhang, Zhang, Xiong and Jiang.
Figures

Similar articles
-
Rumen microbiome structure and metabolites activity in dairy cows with clinical and subclinical mastitis.J Anim Sci Biotechnol. 2021 Feb 8;12(1):36. doi: 10.1186/s40104-020-00543-1. J Anim Sci Biotechnol. 2021. PMID: 33557959 Free PMC article.
-
Discrepancies among healthy, subclinical mastitic, and clinical mastitic cows in fecal microbiome and metabolome and serum metabolome.J Dairy Sci. 2022 Sep;105(9):7668-7688. doi: 10.3168/jds.2021-21654. Epub 2022 Aug 2. J Dairy Sci. 2022. PMID: 35931488
-
Coupling 16S rDNA Sequencing and Untargeted Mass Spectrometry for Milk Microbial Composition and Metabolites from Dairy Cows with Clinical and Subclinical Mastitis.J Agric Food Chem. 2020 Aug 5;68(31):8496-8508. doi: 10.1021/acs.jafc.0c03738. Epub 2020 Jul 22. J Agric Food Chem. 2020. PMID: 32633125
-
Milk metabolite profiling of dairy cows as influenced by mastitis.Front Vet Sci. 2024 Nov 13;11:1475397. doi: 10.3389/fvets.2024.1475397. eCollection 2024. Front Vet Sci. 2024. PMID: 39606657 Free PMC article. Review.
-
Review: Proteomic approaches to control lactational parameters in dairy cows.Animal. 2019 Jul;13(S1):s82-s85. doi: 10.1017/S1751731118003476. Animal. 2019. PMID: 31280743 Review.
Cited by
-
Impact of Calcium Propionate Supplementation on the Lactation Curve and Milk Metabolomic Analysis on Rambouillet Ewes.Vet Sci. 2025 Jan 22;12(2):79. doi: 10.3390/vetsci12020079. Vet Sci. 2025. PMID: 40005839 Free PMC article.
-
Overview of the Potential Impacts of Climate Change on the Microbial Safety of the Dairy Industry.Foods. 2020 Dec 3;9(12):1794. doi: 10.3390/foods9121794. Foods. 2020. PMID: 33287137 Free PMC article. Review.
-
Recent Trends in Food Quality and Authentication: The Role of Omics Technologies in Dairy and Meat Production.Int J Mol Sci. 2025 May 6;26(9):4405. doi: 10.3390/ijms26094405. Int J Mol Sci. 2025. PMID: 40362642 Free PMC article. Review.
-
Application of Metabolomics in Diagnosis of Cow Mastitis: A Review.Front Vet Sci. 2021 Oct 8;8:747519. doi: 10.3389/fvets.2021.747519. eCollection 2021. Front Vet Sci. 2021. PMID: 34692813 Free PMC article. Review.
-
Effect of Heat Stress on Bovine Mammary Cellular Metabolites and Gene Transcription Related to Amino Acid Metabolism, Amino Acid Transportation and Mammalian Target of Rapamycin (mTOR) Signaling.Animals (Basel). 2021 Nov 4;11(11):3153. doi: 10.3390/ani11113153. Animals (Basel). 2021. PMID: 34827885 Free PMC article.
References
-
- Ametaj B. N., Zebeli Q., Saleem F., Psychogios N., Lewis M. J., Dunn S. M., et al. (2010). Metabolomics reveals unhealthy alterations in rumen metabolism with increased proportion of cereal grain in the diet of dairy cows. Metabolomics 6 583–594.
LinkOut - more resources
Full Text Sources
Miscellaneous