. 2019 Nov 8:10:2644.
doi: 10.3389/fmicb.2019.02644. eCollection 2019.

Proteomics-Based Mechanistic Investigation of Escherichia coli Inactivation by Pulsed Electric Field

Affiliations

Proteomics-Based Mechanistic Investigation of Escherichia coli Inactivation by Pulsed Electric Field

Zhenyu Liu et al. Front Microbiol. .

Abstract

The pulsed electric field (PEF) technology has been widely applied to inactivate pathogenic bacteria in food products. Though irreversible pore formation and membrane disruption is considered to be the main contributing factor to PEF's sterilizing effects, the exact molecular mechanisms remain poorly understood. In this study, by using mass spectrometry (MS)-based label-free quantitative proteomic analysis, we compared the protein profiles of PEF-treated and untreated Escherichia coli. We identified a total of 175 differentially expressed proteins, including 52 candidates that were only detected in at least two of the three samples in one experiment group but not in the other group. Functional analysis revealed that the differential proteins were primarily involved in the regulation of cell membrane composition and integrity, stress response, as well as various metabolic processes. Quantitative reverse-transcription polymerase chain reaction (qRT-PCR) analysis was conducted on the genes of selected differential proteins at varying PEF intensities, which were known to result in different cell killing levels. The qRT-PCR data confirmed that the proteomic results could be reliably used for further data interpretation, and that the changes in the expression levels of the differential candidates were, to a large extent, caused directly by the PEF treatment. The findings of the current study offered valuable insight into PEF-induced cell inactivation.

Keywords: E. coli; cell inactivation; molecular mechanisms; proteomics; pulsed electric field.


Figures

FIGURE 1
FIGURE 1
(A) Schematic diagram of the PEF device setup (Liu Z.Y. et al., 2016) and (B) wave shape of the pulse.
FIGURE 2
FIGURE 2
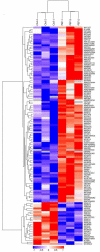
Hierarchical clustering of 123 differentially expressed proteins (confidently detected in all six samples; fold-change >1.5 or <0.67, and p < 0.05; see Table 1). Results are illustrated using a heat map with a dendrogram. The Uniprot ID of each protein is listed in the column to the right of the heat map. The color bar located below the heat map denotes the extent of change in expression level, with red indicating up-regulation and blue down-regulation.
FIGURE 3
FIGURE 3
Gene ontology (GO) annotation and enrichment analysis of all 175 differentially expressed proteins. (A) The primary Y axis denotes the number of annotated proteins categorized to each GO term. The secondary Y axis represents the percentage of annotated proteins belonging to each GO term in all differential proteins. GO terms are classified into three subcategories, including biological process (BP, red), molecular function (MF, purple) and, cellular compartment (CC, orange). (B) The color gradient from orange to red represents the p-value; the closer the color to red, the lower the p-value and the higher the significance level corresponding to the enrichment. The small number above each column is the rich factor, which denotes the ratio of the number of differential proteins enriched to a given GO term to the number of all annotated proteins categorized to the same GO term.
FIGURE 4
FIGURE 4
KEGG pathway and enrichment analysis of all 175 differentially expressed proteins. (A) The Y axis indicates the number of annotated proteins that are categorized into each KEGG pathway. Only the top 20 pathways are shown. (B) Sulfur metabolism is the only KEGG pathway found to be significantly enriched. (C) An illustration of the cellular processes associated with sulfur metabolism pathways. All differential proteins captured in this study are highlighted in red. Small circles (o) represent small-molecule metabolites (Source: Kanehisa et al., 2019).
FIGURE 5
FIGURE 5
PPI network based on 124 proteins from all 175 differentially expressed proteins. Nodes and lines represent the protein and their interactions, respectively.
FIGURE 6
FIGURE 6
The effect of PEF treatment on the expression of selected E. coli genes under different pulse conditions (p < 0.05, ∗∗p < 0.01, ∗∗∗p < 0.001). The gene expression data are arranged in separate column charts due the fold-change values of pstS being significantly greater than those of other genes. The pulse conditions and cell killing extent for each sample are as follows: control sample: untreated; PEF-treated sample 1: pulse intensity – 2.88 kV cm–1, pulse number – 62, pulse duration – 82 μs, cell killing extent – 29 ± 0.7%; PEF-treated sample 2: pulse intensity – 6.10 kV cm–1, pulse number – 54, pulse duration – 77 μs, cell killing extent – 51 ± 1.3%; PEF-treated sample 3: pulse intensity – 14.5 kV cm–1, pulse number – 26, pulse duration – 67 μs, cell killing extent – 95 ± 2.0%.

References

    1. Aronsson K., Rönner U., Borch E. (2005). Inactivation of Escherichia coli, listeria innocua and saccharomyces cerevisiae in relation to membrane permeabilization and subsequent leakage of intracellular compounds due to pulsed electric field processing. Int. J. Food Microbiol. 99 19–32. 10.1016/j.ijfoodmicro.2004.07.012 - DOI - PubMed
    1. Bolla J. R. (2014). Bacterial Multidrug Efflux Pumps: Structure, Function and Regulation. Ph.D. thesis, Iowa State University, Ames, IA.
    1. Cebrián G., Condón S., Mañas P. (2016). Influence of growth and treatment temperature on staphylococcus aureus resistance to pulsed electric fields: relationship with membrane fluidity. Innov. Food Sci. Emerg. Technol. 37 161–169. 10.1016/j.ifset.2016.08.011 - DOI
    1. Chueca B., Pagán R., García-Gonzalo D. (2015). Transcriptomic analysis of Escherichia coli MG1655 cells exposed to pulsed electric fields. Innov. Food Sci. Emerg. Technol. 29 78–86. 10.1016/j.ifset.2014.09.003 - DOI
    1. Clark J. (2006). Pulsed electric field processing. Food Technol. 60 66–67.

LinkOut - more resources