Metabolic Dynamics of Developing Rice Seeds Under High Night-Time Temperature Stress
- PMID: 31781147
- PMCID: PMC6857699
- DOI: 10.3389/fpls.2019.01443
Metabolic Dynamics of Developing Rice Seeds Under High Night-Time Temperature Stress
Abstract
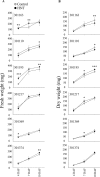
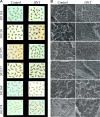
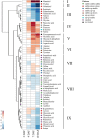
High temperature stress during rice reproductive development results in yield losses. Reduced grain yield and grain quality has been associated with high temperature stress, and specifically with high night-time temperatures (HNT). Characterizing the impact of HNT on the phenotypic and metabolic status of developing rice seeds can provide insights into the mechanisms involved in yield and quality decline. Here, we examined the impact of warmer nights on the morphology and metabolome during early seed development in six diverse rice accessions. Seed size was sensitive to HNT in four of the six genotypes, while seed fertility and seed weight were unaffected. We observed genotypic differences for negative impact of HNT on grain quality. This was evident from the chalky grain appearance due to impaired packaging of starch granules. Metabolite profiles during early seed development (3 and 4 days after fertilization; DAF) were distinct from the early grain filling stages (7 and 10 DAF) under optimal conditions. We observed that accumulation of sugars (sucrose, fructose, and glucose) peaked at 7 DAF suggesting a major flux of carbon into glycolysis, tricarboxylic acid cycle, and starch biosynthesis during grain filling. Next, we determined hyper (HNT > control) and hypo (HNT < control) abundant metabolites and found 19 of the 57 metabolites to differ significantly between HNT and control treatments. The most prominent changes were exhibited by differential abundance of sugar and sugar alcohols under HNT, which could be linked to a protective mechanism against the HNT damage. Overall, our results indicate that combining metabolic profiles of developing grains with yield and quality parameters under high night temperature stress could provide insight for exploration of natural variation for HNT tolerance in the rice germplasm.
Keywords: early seed development; grain filling; high night-time temperature; metabolite profiling; rice; starch.
Copyright © 2019 Dhatt, Abshire, Paul, Hasanthika, Sandhu, Zhang, Obata and Walia.
Figures


Similar articles
-
Tissue- and time-dependent metabolite profiles during early grain development under normal and high night-time temperature conditions.BMC Plant Biol. 2024 Jun 18;24(1):568. doi: 10.1186/s12870-024-05190-6. BMC Plant Biol. 2024. PMID: 38886651 Free PMC article.
-
High day- and night-time temperatures affect grain growth dynamics in contrasting rice genotypes.J Exp Bot. 2017 Nov 2;68(18):5233-5245. doi: 10.1093/jxb/erx344. J Exp Bot. 2017. PMID: 29106621 Free PMC article.
-
Allelic variation in rice Fertilization Independent Endosperm 1 contributes to grain width under high night temperature stress.New Phytol. 2021 Jan;229(1):335-350. doi: 10.1111/nph.16897. Epub 2020 Sep 23. New Phytol. 2021. PMID: 32858766 Free PMC article.
-
High night temperature effects on wheat and rice: Current status and way forward.Plant Cell Environ. 2021 Jul;44(7):2049-2065. doi: 10.1111/pce.14028. Epub 2021 Feb 23. Plant Cell Environ. 2021. PMID: 33576033 Review.
-
High night temperature stress on rice (Oryza sativa) - insights from phenomics to physiology. A review.Funct Plant Biol. 2024 May;51:FP24057. doi: 10.1071/FP24057. Funct Plant Biol. 2024. PMID: 38815128 Review.
Cited by
-
Rhizosphere melatonin application reprograms nitrogen-cycling related microorganisms to modulate low temperature response in barley.Front Plant Sci. 2022 Oct 6;13:998861. doi: 10.3389/fpls.2022.998861. eCollection 2022. Front Plant Sci. 2022. PMID: 36275608 Free PMC article.
-
Phenotypic and transcriptomic responses of diverse rice accessions to transient heat stress during early grain development.Front Plant Sci. 2024 Aug 15;15:1429697. doi: 10.3389/fpls.2024.1429697. eCollection 2024. Front Plant Sci. 2024. PMID: 39211842 Free PMC article.
-
Genotype-dependent and heat-induced grain chalkiness in rice correlates with the expression patterns of starch biosynthesis genes.Plant Environ Interact. 2021 Jun 15;2(4):165-176. doi: 10.1002/pei3.10054. eCollection 2021 Aug. Plant Environ Interact. 2021. PMID: 37283703 Free PMC article.
-
A Deep Learning Framework for Processing and Classification of Hyperspectral Rice Seed Images Grown under High Day and Night Temperatures.Sensors (Basel). 2023 Apr 28;23(9):4370. doi: 10.3390/s23094370. Sensors (Basel). 2023. PMID: 37177572 Free PMC article.
-
SeedExtractor: An Open-Source GUI for Seed Image Analysis.Front Plant Sci. 2021 Feb 1;11:581546. doi: 10.3389/fpls.2020.581546. eCollection 2020. Front Plant Sci. 2021. PMID: 33597957 Free PMC article.
References
-
- Abayawickrama A. S. M. T., Reinke R. F., Fitzgerald M. A., Harper J. D. I., Burrows G. E. (2017). Influence of high daytime temperature during the grain filling stage on fissure formation in rice. J. Cereal Sci. 74, 256–262. 10.1016/J.JCS.2017.02.013 - DOI
-
- Ali F., Waters D. L. E., Ovenden B., Bundock P., Raymond C. A., Rose T. J. (2019). Australian rice varieties vary in grain yield response to heat stress during reproductive and grain filling stages. J. Agron. Crop Sci. 205, 179–187. 10.1111/jac.12312 - DOI
LinkOut - more resources
Full Text Sources
Miscellaneous

