. 2019 Nov 3:2019:8628027.
doi: 10.1155/2019/8628027. eCollection 2019.

Human Umbilical Cord-Derived Mesenchymal Stem Cell Therapy Ameliorates Nonalcoholic Fatty Liver Disease in Obese Type 2 Diabetic Mice

Affiliations

Human Umbilical Cord-Derived Mesenchymal Stem Cell Therapy Ameliorates Nonalcoholic Fatty Liver Disease in Obese Type 2 Diabetic Mice

Bing Li et al. Stem Cells Int. .

Abstract

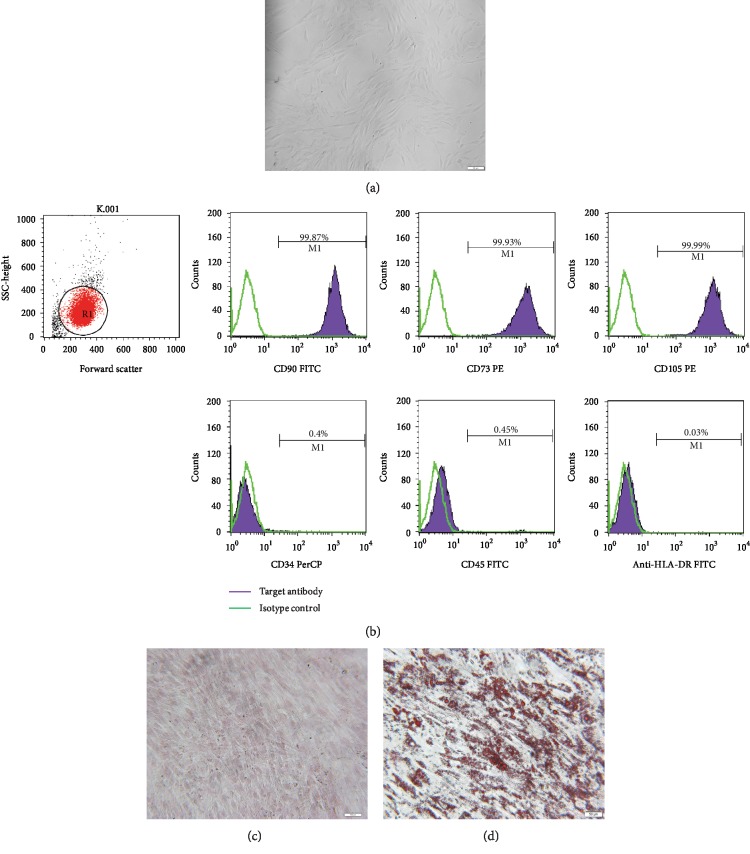
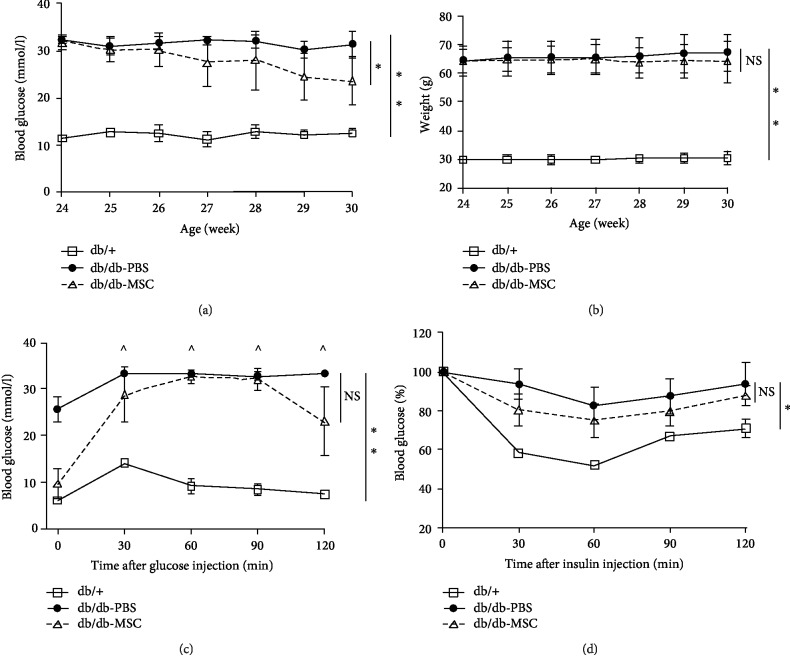
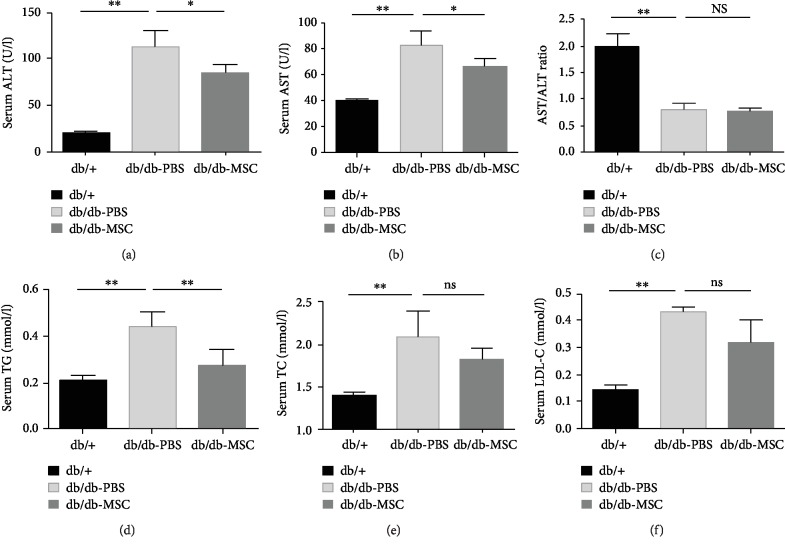
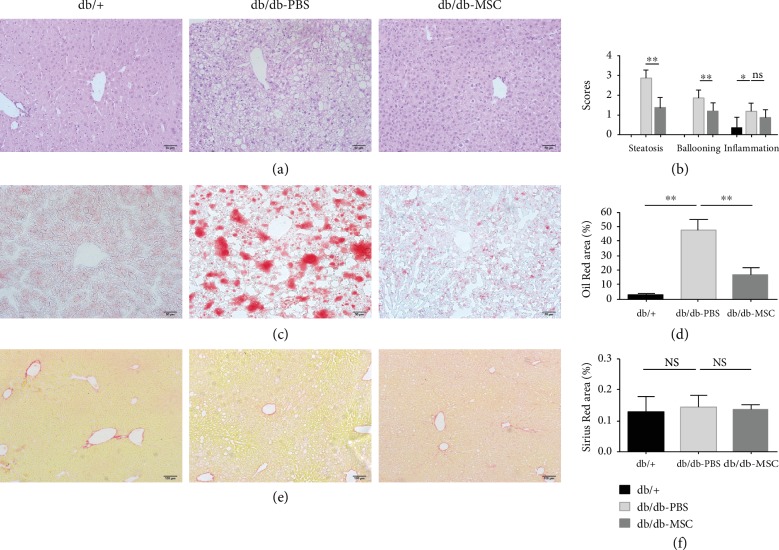
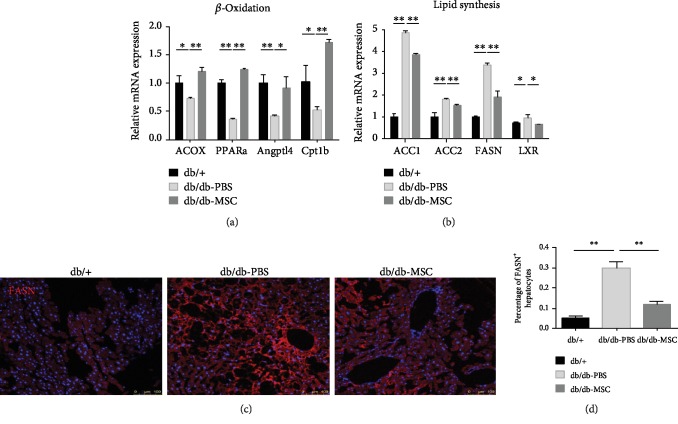
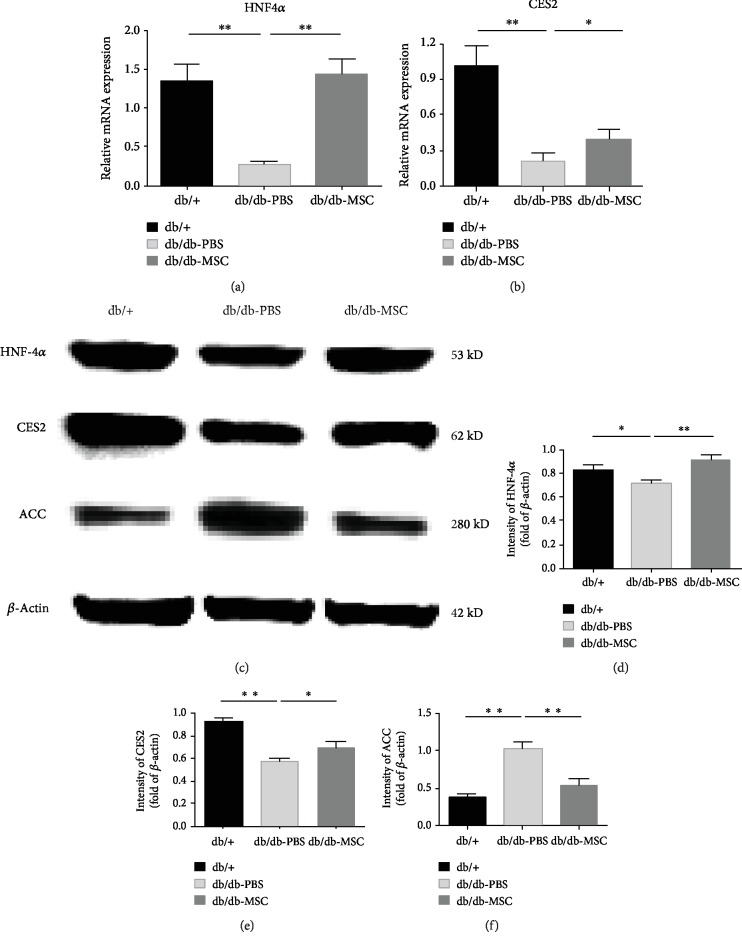
Nonalcoholic fatty liver disease (NAFLD) is increasingly common among patients with type 2 diabetes mellitus (T2DM). The two conditions can act synergistically to produce adverse outcomes. However, the therapeutic options for patients with NAFLD and T2DM are currently limited. Human umbilical cord-derived mesenchymal stem cells (UC-MSCs) have shown therapeutic potential for diabetes and hepatic disorders such as liver cirrhosis and fulminant hepatic failure. The present study is aimed at investigating the effect of human UC-MSCs on a mouse model of NAFLD and T2DM, characterized by obesity-induced hyperglycaemia, dyslipidaemia, hepatic steatosis, and liver dysfunction. Thirty-week-old male C57BL/6 db/db mice were infused with human UC-MSCs or phosphate-buffered saline (PBS) via the tail vein once a week for six weeks. Age-matched male C57BL/6 wild-type db/+ mice were used as controls. Body weight and random blood glucose were measured every week. One week after the sixth infusion, intraperitoneal glucose tolerance tests and insulin tolerance tests were performed and the blood and liver were harvested for biochemical and histopathological examinations. Quantitative real-time reverse transcriptase polymerase chain reaction (qRT-PCR), immunofluorescence staining, and western blot were performed to monitor the expression of the lipid metabolism- and regulatory pathway-related genes. UC-MSC infusions significantly ameliorated hyperglycaemia, attenuated the elevation of hepatic transaminases, and decreased lipid contents, including triglyceride, total cholesterol, and low-density lipoprotein cholesterol. Moreover, histological lesions in the liver diminished markedly, as evidenced by reduced lipid accumulation and attenuated hepatic steatosis. Mechanistically, UC-MSCs were found to regulate lipid metabolism by increasing the expression of fatty acid oxidation-related genes and inhibiting the expression of lipogenesis-related genes, which were associated with the upregulation of the HNF4α-CES2 pathway. Our results demonstrate that human UC-MSCs can ameliorate NAFLD and reverse metabolic syndrome in db/db mice. Thus, UC-MSCs may serve as a novel therapeutic agent for T2DM patients with NAFLD.


Conflict of interest statement

The authors declare that there is no conflict of interest regarding the publication of this paper.

Figures

Figure 1
Figure 1
Identification of human UC-MSCs. (a) Morphological features. The MSCs appeared spindle-like and fibroblastoid-shaped. Scale bar = 100 μm. (b) Flow cytometric analysis of the expression of cell surface markers related to human UC-MSCs. The expression of each antigen was presented with the corresponding isotype control. (c) Alizarin Red S staining of cultured osteogenic human UC-MSCs. Scale bar = 100 μm. (d) Oil Red O staining of cultured adipogenic human UC-MSCs. Scale bar = 50 μm.
Figure 2
Figure 2
Human UC-MSC infusions improved glucose homeostasis. db/db mice were infused with human UC-MSCs or PBS once a week for six weeks. Blood glucose levels (a) and body weight (b) of the indicated groups were monitored once a week during the whole experiment period. (c) IPGTT was performed on the indicated groups to assess glucose tolerance. ^ indicates that the blood glucose level exceeded the maximum (33.3 mmol/l) of the glucometer. (d) IPITT was performed on the indicated groups to assess insulin tolerance, and the results were presented relative to the initial blood glucose levels. All the results are expressed as the means ± SD. n = 6 mice per group. p < 0.05; ∗∗p < 0.01. ns: not significant; IPGTT: intraperitoneal glucose tolerance tests; IPITT: intraperitoneal insulin tolerance tests.
Figure 3
Figure 3
Human UC-MSC infusions relieved functional hepatic injury and improved lipid profiles. db/db mice were infused with human UC-MSCs or PBS once a week for six weeks. One week after the infusions, serum concentrations of ALT (a), AST (b), AST/ALT ratio (c), TG (d), TC (e), and LDL-C (f) in the indicated groups were measured. All data are represented as means ± SD. n = 6 mice per group. p < 0.05; ∗∗p < 0.01. ns: not significant.
Figure 4
Figure 4
Human UC-MSC infusions ameliorated hepatic steatosis. (a) Representative images of HE-stained liver sections of the indicated groups. Scale bar = 50 μm. (b) Steatosis, ballooning, and inflammation in the liver of the indicated groups were scored. (c) Representative images of Oil Red O-stained liver sections of the indicated groups. Scale bar = 50 μm. (e) Representative images of Sirius Red-stained liver sections of the indicated groups, scale bar = 100 μm. Quantitative analysis of (d) the Oil Red O-positive area and (f) the Sirius Red-positive area in the respective groups. n = 5 sections per group. All data are represented as means ± SD. p < 0.05; ∗∗p < 0.01. ns: not significant.
Figure 5
Figure 5
Human UC-MSC infusions promoted β-oxidation and suppressed lipogenesis. Transcript levels of genes related to β-oxidation (a) and lipogenesis (b) in the livers of the indicated groups assessed by qRT-PCR. Each experiment was repeated 3 times. (c) Immunofluorescence staining for FASN-positive hepatocytes (bright red fluorescence) in representative liver sections of the indicated groups (n = 5 sections per group). (d) The proportion of FASN-positive hepatocytes was quantified. All the data are expressed as means ± SD. p < 0.05; ∗∗p < 0.01.
Figure 6
Figure 6
Human UC-MSC infusions upregulated the HNF4α and CES2 expressions. Transcript levels of HNF4α (a) and CES2 (b) in the livers of the indicated groups assessed by qRT-PCR. (c) Protein levels of HNF4α, CES2, and ACC assessed by western blot (β-actin served as the loading control). (d–f) Statistical analysis of HNF4α, CES2, and ACC protein levels. Each experiment was repeated three times, and typical pictures were shown. Data are expressed as means ± SD. p < 0.05; ∗∗p < 0.01.

References

    1. Garvey W. T., Mechanick J. I., Brett E. M., et al. American Association of Clinical Endocrinologists and American College of Endocrinology comprehensive clinical practice guidelines for medical care of patients with obesity. Endocrine Practice. 2016;22(Supplement 3):1–203. doi: 10.4158/EP161365.GL. - DOI - PubMed
    1. Dharmalingam M., Yamas P. G. Nonalcoholic fatty liver disease and type 2 diabetes mellitus. Indian Journal of Endocrinology and Metabolism. 2018;22(3):421–428. doi: 10.4103/ijem.IJEM_585_17. - DOI - PMC - PubMed
    1. Anstee Q. M., McPherson S., Day C. P. How big a problem is non-alcoholic fatty liver disease? BMJ. 2011;343(jul18 1):p. d3897. doi: 10.1136/bmj.d3897. - DOI - PubMed
    1. Bril F., Cusi K. Management of nonalcoholic fatty liver disease in patients with type 2 diabetes: a call to action. Diabetes Care. 2017;40(3):419–430. doi: 10.2337/dc16-1787. - DOI - PubMed
    1. Hazlehurst J. M., Woods C., Marjot T., Cobbold J. F., Tomlinson J. W. Non-alcoholic fatty liver disease and diabetes. Metabolism. 2016;65(8):1096–1108. doi: 10.1016/j.metabol.2016.01.001. - DOI - PMC - PubMed

LinkOut - more resources