

Label-Free Proteomics of the Fetal Pancreas Identifies Deficits in the Peroxisome in Rats with Intrauterine Growth Restriction
- PMID: 31781323
- PMCID: PMC6874927
- DOI: 10.1155/2019/1520753
Label-Free Proteomics of the Fetal Pancreas Identifies Deficits in the Peroxisome in Rats with Intrauterine Growth Restriction
Abstract
Aim: The objective of the present study was to identify differentially expressed proteins (DEPs) in the pancreas of a fetus with intrauterine growth restriction (IUGR) and to investigate the molecular mechanisms leading to adulthood diabetes in IUGR.
Methods: The IUGR rat model was induced by maternal protein malnutrition. The fetal pancreas was collected at embryonic day 20 (E20). Protein was extracted, pooled, and subjected to label-free quantitative proteomic analysis. Bioinformatics analysis (GO and IPA) was performed to define the pathways and networks associated with DEPs. LC-MS results were confirmed by western blotting and/or quantitative PCR (q-PCR). The principal parameters of oxidative stress-superoxide dismutase (Sod) were determined in blood samples of fetal rats.
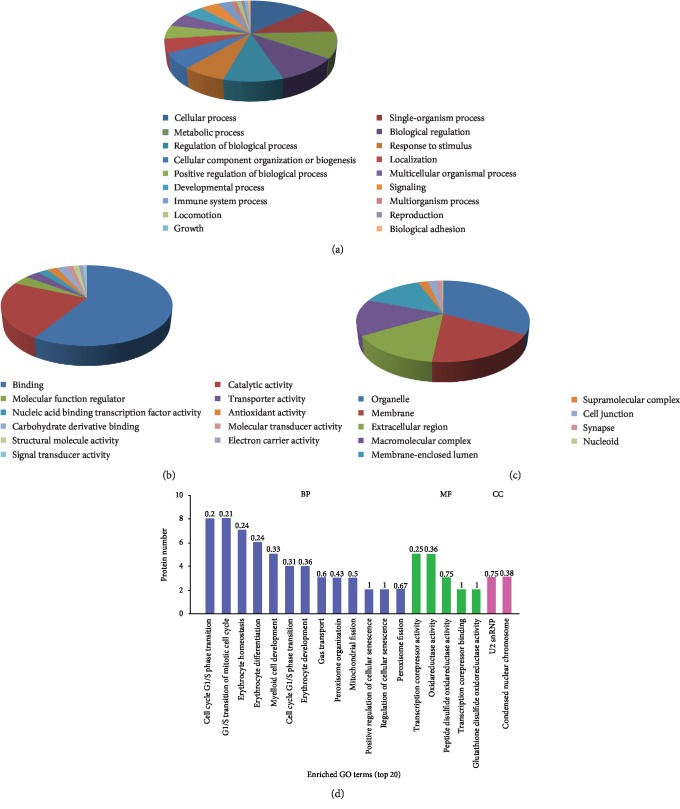
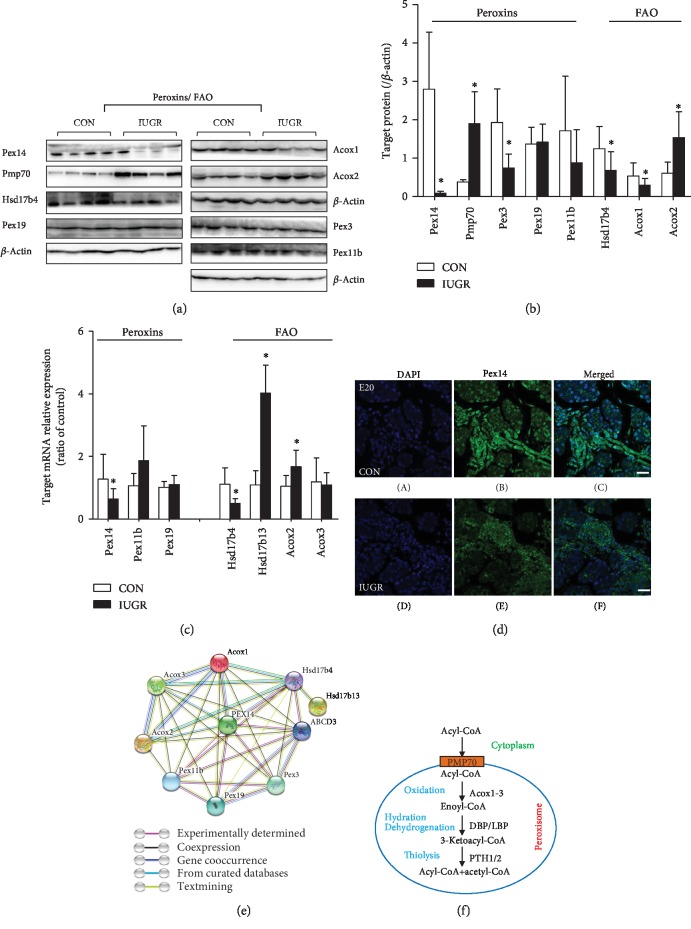
Results: A total of 57 DEPs (27 upregulated, 30 downregulated) were identified with a 1.5-fold change threshold and a p value ≤ 0.05 between the IUGR and the control pancreas. Bioinformatics analysis revealed that these proteins play important roles in peroxisome biogenesis and fission, fatty acid beta-oxidation (FAO), mitotic cell cycle, and histone modification. The peroxin Pex14 was downregulated in the IUGR pancreas as confirmed by western blotting and q-PCR. Pmp70, a peroxisomal membrane protein involved in the transport of fatty acids, was upregulated. Hsd17b4 and Acox1/2, which catalyze different steps of peroxisomal FAO, were dysregulated. Sod plasma concentrations in the IUGR fetus were higher than those in the control, suggesting partial compensation for oxidative stress. Multiple DEPs were related to the regulation of the cell cycle, including reduced Cdk1, Mcm2, and Brd4. The histone acetylation regulators Hdac1/2 were downregulated, whereas Sirt1/3 and acetylated H3K56 were increased in the IUGR fetal pancreas.
Conclusion: The present study identified DEPs in the fetal pancreas of IUGR rats by proteomic analysis. Downregulation of pancreas peroxins and dysregulation of enzymes involved in peroxisomal FAO may impair the biogenesis and function of the peroxisome and may underlie the development of T2 diabetes mellitus in adult IUGR rats. Disorders of cell cycle regulators may induce cell division arrest and lead to smaller islets. The present data provide new insight into the role of the peroxisome in the development of the pancreas and may be valuable in furthering our understanding of the pathogenesis of IUGR-induced diabetes.
Copyright © 2019 Xiaomei Liu et al.
Conflict of interest statement
The authors declare that there is no conflict of interest regarding the publication of this article.
Figures


Similar articles
-
iTRAQ-Based Proteomic Analysis of Neonatal Kidney from Offspring of Protein Restricted Rats Reveals Abnormalities in Intraflagellar Transport Proteins.Cell Physiol Biochem. 2017;44(1):185-199. doi: 10.1159/000484626. Epub 2017 Nov 6. Cell Physiol Biochem. 2017. PMID: 29130966
-
Detection of expressional changes induced by intrauterine growth restriction in the developing rat pancreas.Exp Biol Med (Maywood). 2016 Jul;241(13):1446-56. doi: 10.1177/1535370216638771. Epub 2016 May 17. Exp Biol Med (Maywood). 2016. PMID: 27190278 Free PMC article.
-
Transcriptome analysis reveals hepatic disordered lipid metabolism, lipotoxic injury, and abnormal development in IUGR sheep fetuses due to maternal undernutrition during late pregnancy.Theriogenology. 2024 Sep 15;226:350-362. doi: 10.1016/j.theriogenology.2024.06.020. Epub 2024 Jun 24. Theriogenology. 2024. PMID: 38968678
-
The impact of IUGR on pancreatic islet development and β-cell function.J Endocrinol. 2017 Nov;235(2):R63-R76. doi: 10.1530/JOE-17-0076. Epub 2017 Aug 14. J Endocrinol. 2017. PMID: 28808079 Free PMC article. Review.
-
Models of Intrauterine growth restriction and fetal programming in rabbits.Mol Reprod Dev. 2019 Dec;86(12):1781-1809. doi: 10.1002/mrd.23271. Epub 2019 Sep 20. Mol Reprod Dev. 2019. PMID: 31538701 Review.
Cited by
-
Comparative Proteomic Analysis to Investigate the Pathogenesis of Oral Adenoid Cystic Carcinoma.ACS Omega. 2021 Jul 16;6(29):18623-18634. doi: 10.1021/acsomega.1c01270. eCollection 2021 Jul 27. ACS Omega. 2021. PMID: 34337202 Free PMC article.
-
Fetal Cardiac Lipid Sensing Triggers an Early and Sex-related Metabolic Energy Switch in Intrauterine Growth Restriction.J Clin Endocrinol Metab. 2021 Oct 21;106(11):3295-3311. doi: 10.1210/clinem/dgab496. J Clin Endocrinol Metab. 2021. PMID: 34245263 Free PMC article.
-
Peroxisome Deficiency Dysregulates Fatty Acid Oxidization and Exacerbates Lipotoxicity in β Cells.Oxid Med Cell Longev. 2021 Aug 22;2021:7726058. doi: 10.1155/2021/7726058. eCollection 2021. Oxid Med Cell Longev. 2021. PMID: 34471469 Free PMC article.
-
The peroxisome: an update on mysteries 3.0.Histochem Cell Biol. 2024 Feb;161(2):99-132. doi: 10.1007/s00418-023-02259-5. Epub 2024 Jan 20. Histochem Cell Biol. 2024. PMID: 38244103 Free PMC article. Review.
References
-
- Limesand S. W., Jensen J., Hutton J. C., Hay W. W., Jr. Diminished β-cell replication contributes to reduced β-cell mass in fetal sheep with intrauterine growth restriction. American Journal of Physiology-Regulatory, Integrative and Comparative Physiology. 2005;288:R1297–R1305. doi: 10.1152/ajpregu.00494.2004. - DOI - PubMed
MeSH terms
LinkOut - more resources
Full Text Sources
Miscellaneous
