

Helicobacter pylori Infection Aggravates Dysbiosis of Gut Microbiome in Children With Gastritis
- PMID: 31781514
- PMCID: PMC6859803
- DOI: 10.3389/fcimb.2019.00375
Helicobacter pylori Infection Aggravates Dysbiosis of Gut Microbiome in Children With Gastritis
Abstract
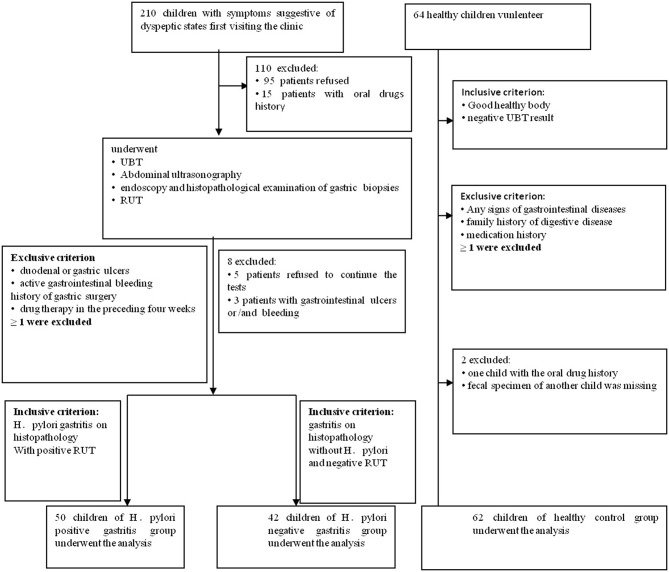
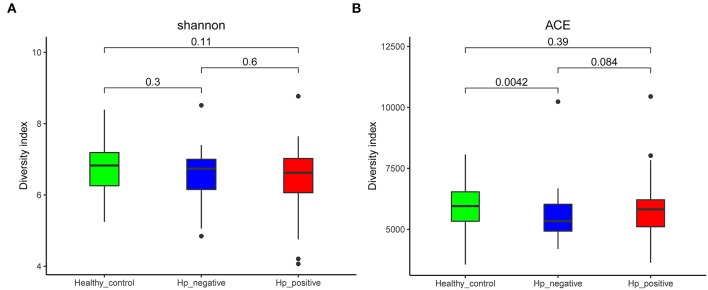
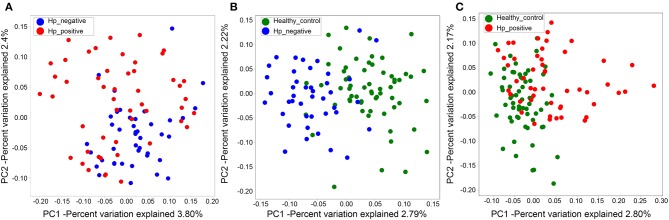
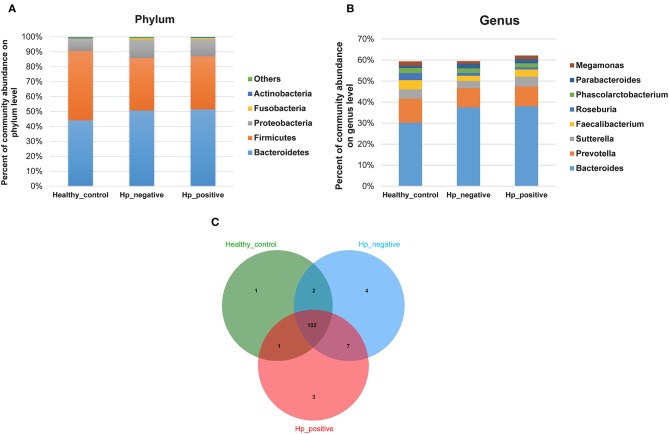
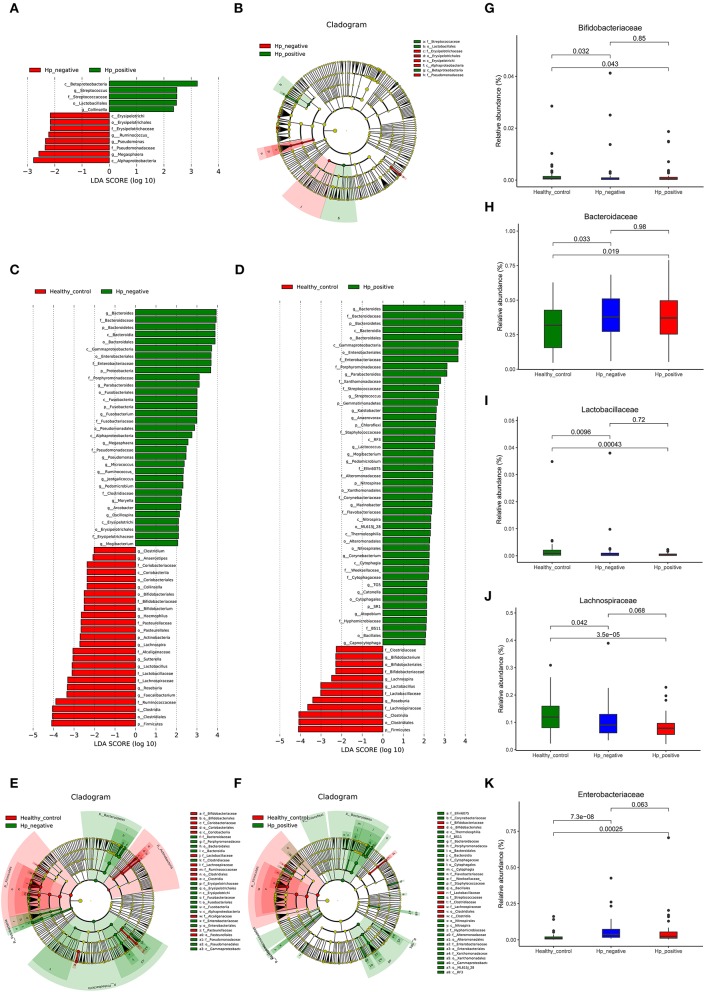
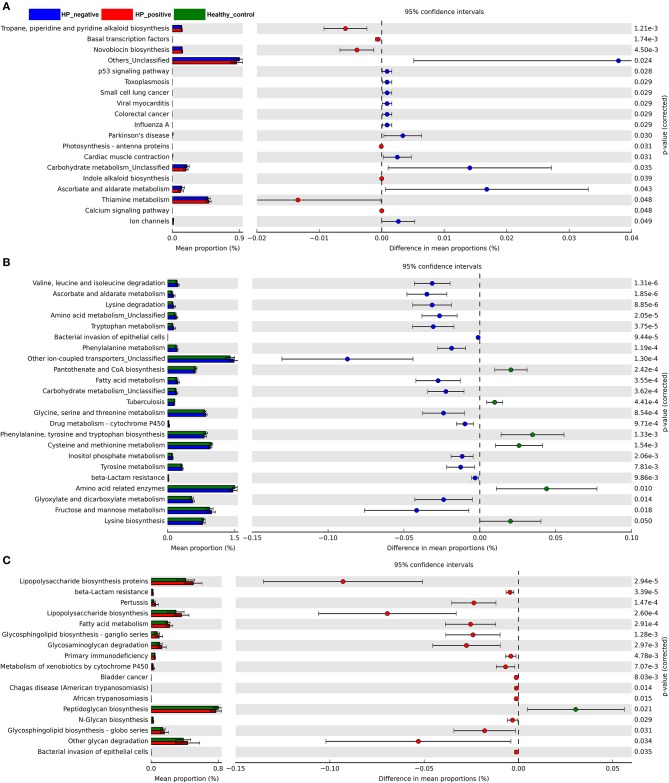
Introduction:Helicobacter pylori infection consistently leads to chronic and low degree of inflammatory response in gastric mucosa and is closely related with gastrointestinal and extra-gastric diseases. Effects of local microbiome in the stomach have been studied in adults and children with H. pylori infection. It is, however, not known whether the intestinal microbial community differs in children with varying H. pylori infection. The aim of this study is to characterize the altered composition of microbiome induced by H. pylori infection and in gastritis. Materials and Methods: This study involved 154 individuals, including 50 children affected by H. pylori-induced gastritis, 42 children with H. pylori-negative gastritis, and 62 healthy controls. Gut microbiome composition was analyzed using 16S rRNA gene-based pyrosequencing. Fecal bacterial diversity and composition were then compared. Results: On the basis of an analysis of similarities and differences, we found that children with H. pylori-induced gastritis exhibited gut bacteria dysbiosis. The ratio of Firmicutes/Bacteroidetes (F:B) at the phylum level had dramatically decreased in H. pylori-positive gastritis group (HPG) and H. pylori-negative gastritis group (HNG), compared with the healthy control group (HCG). At the family and genus levels, relative abundance of Bacteroidaceae and Enterobacteriaceae was prevalent in HPG and HNG, whereas relative abundance of Lachnospiraceae, Bifidobacteriaceae, and Lactobacillaceae was seen in HCG. Prevalence of different taxa of gut microbiome at the class, order, family, and genus levels was also observed among the three groups. Conclusions: Gastritis can cause changes in composition of fecal microbiome, which is exacerbated by H. pylori infection. These changes in gut microbiome may be related to drug resistance and development of chronic gastrointestinal diseases.
Keywords: Helicobacter pylori; children; gastritis; gut microbiome; infection.
Copyright © 2019 Yang, Zhang, Xu, Wei, Yang, Liu, Li, Zhao, Wang, Zhang and Gai.
Figures
Similar articles
-
Association Between Gut Microbiota and Helicobacter pylori-Related Gastric Lesions in a High-Risk Population of Gastric Cancer.Front Cell Infect Microbiol. 2018 Jun 19;8:202. doi: 10.3389/fcimb.2018.00202. eCollection 2018. Front Cell Infect Microbiol. 2018. PMID: 29971220 Free PMC article.
-
Gastric Microbiota in a Low-Helicobacter pylori Prevalence General Population and Their Associations With Gastric Lesions.Clin Transl Gastroenterol. 2020 Jul;11(7):e00191. doi: 10.14309/ctg.0000000000000191. Clin Transl Gastroenterol. 2020. PMID: 32764211 Free PMC article.
-
The Systemic Impact of Helicobacter pylori Infection on the Microbiome of Whole Digestive Tract Based on Mucosal, Gastric Juice, and Fecal Specimens.Helicobacter. 2025 May-Jun;30(3):e70047. doi: 10.1111/hel.70047. Helicobacter. 2025. PMID: 40426336
-
Suicide journey of H. pylori through gastric carcinogenesis: the role of non-H. pylori microbiome and potential consequences for clinical practice.Eur J Clin Microbiol Infect Dis. 2019 Sep;38(9):1591-1597. doi: 10.1007/s10096-019-03564-5. Epub 2019 Apr 17. Eur J Clin Microbiol Infect Dis. 2019. PMID: 31114971 Review.
-
Gut Microbiota: The Missing Link Between Helicobacter pylori Infection and Metabolic Disorders?Front Endocrinol (Lausanne). 2021 Jun 17;12:639856. doi: 10.3389/fendo.2021.639856. eCollection 2021. Front Endocrinol (Lausanne). 2021. PMID: 34220702 Free PMC article. Review.
Cited by
-
The interplay between Helicobacter pylori and the gut microbiota: An emerging driver influencing the immune system homeostasis and gastric carcinogenesis.Front Cell Infect Microbiol. 2022 Aug 15;12:953718. doi: 10.3389/fcimb.2022.953718. eCollection 2022. Front Cell Infect Microbiol. 2022. PMID: 36046747 Free PMC article. Review.
-
Effects of cat ownership on the gut microbiota of owners.PLoS One. 2021 Jun 16;16(6):e0253133. doi: 10.1371/journal.pone.0253133. eCollection 2021. PLoS One. 2021. PMID: 34133453 Free PMC article.
-
Review of Phytochemical Potency as a Natural Anti-Helicobacter pylori and Neuroprotective Agent.Molecules. 2023 Oct 18;28(20):7150. doi: 10.3390/molecules28207150. Molecules. 2023. PMID: 37894629 Free PMC article. Review.
-
The double-edged sword of probiotic supplementation on gut microbiota structure in Helicobacter pylori management.Gut Microbes. 2022 Jan-Dec;14(1):2108655. doi: 10.1080/19490976.2022.2108655. Gut Microbes. 2022. PMID: 35951774 Free PMC article. Review.
-
Progress in elucidating the relationship between Helicobacter pylori infection and intestinal diseases.World J Gastroenterol. 2021 Dec 21;27(47):8040-8046. doi: 10.3748/wjg.v27.i47.8040. World J Gastroenterol. 2021. PMID: 35068852 Free PMC article.
References
Publication types
MeSH terms
Substances
LinkOut - more resources
Full Text Sources
Medical