

Effect of Bitter Compounds on the Expression of Bitter Taste Receptor T2R7 Downstream Signaling Effectors in cT2R7/pDisplay-G α 16/gust44/pcDNA3.1 (+) Cells
- PMID: 31781630
- PMCID: PMC6875361
- DOI: 10.1155/2019/6301915
Effect of Bitter Compounds on the Expression of Bitter Taste Receptor T2R7 Downstream Signaling Effectors in cT2R7/pDisplay-G α 16/gust44/pcDNA3.1 (+) Cells
Abstract
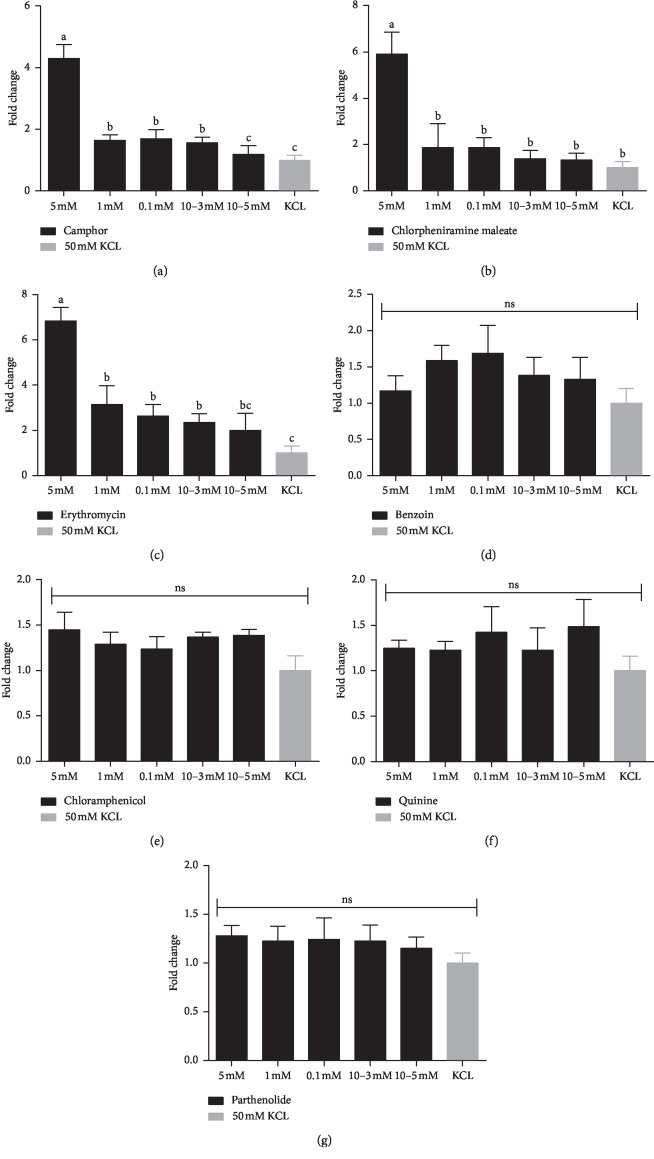
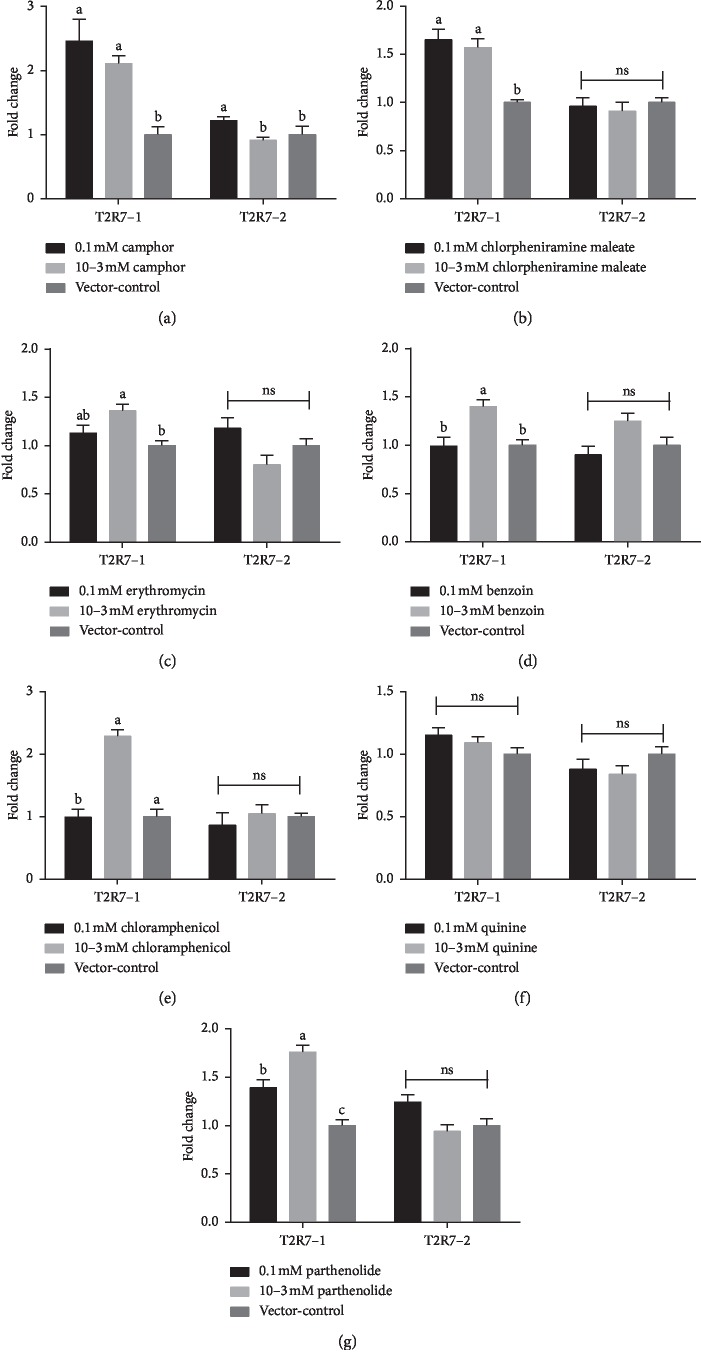
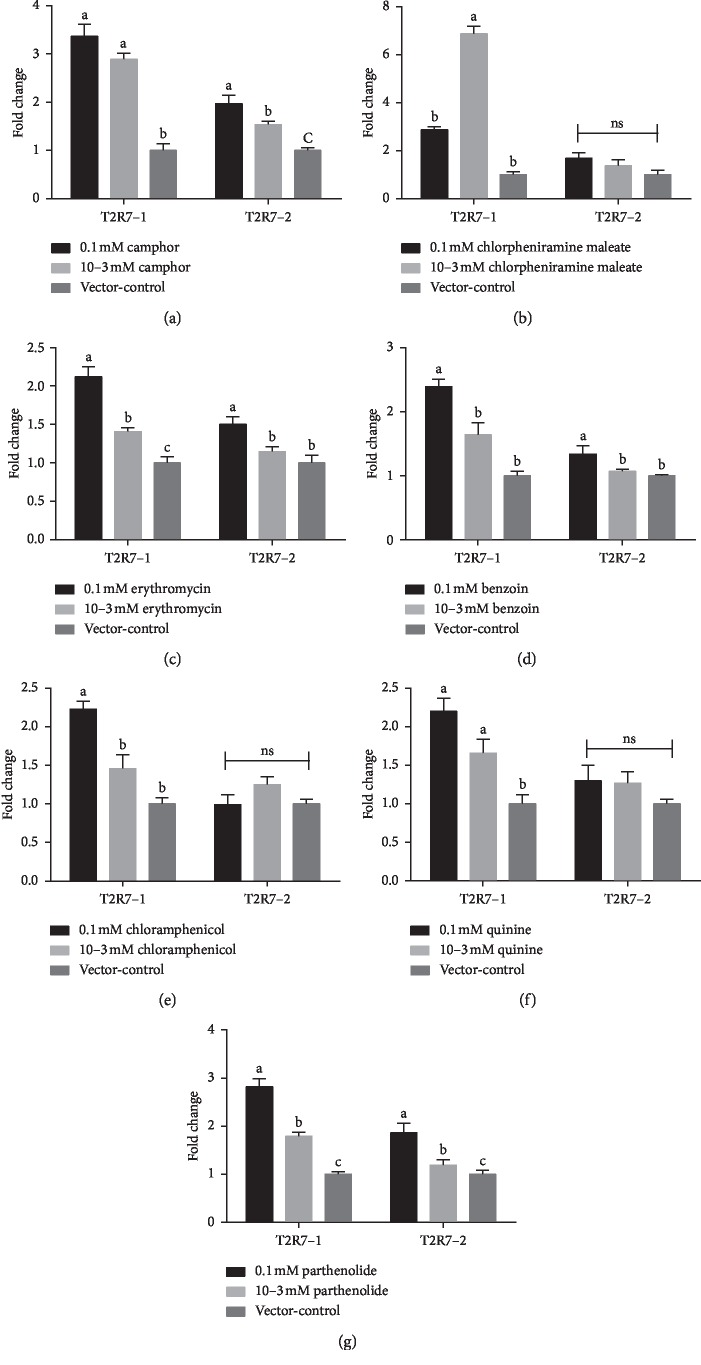
Bitterness is an important taste sensation for chickens, which provides useful sensory information for acquisition and selection of diet, and warns them against ingestion of potentially harmful and noxious substances in nature. Bitter taste receptors (T2Rs) mediate the recognition of bitter compounds belonging to a family of proteins known as G-protein coupled receptors. The aim of this study was to identify and evaluate the expression of T2R7 in chicken tongue tissue and construct cT2R7-1 and cT2R7-2-expressing HEK-293T cells to access the expression of PLCβ2 and ITPR3 after exposure with different concentrations of the bitter compounds. Using real-time PCR, we show that the relative expression level of T2R7 mRNA in 5, 1, 0.1, and 10-3 mM of camphor and erythromycin solutions and 5 mM of chlorpheniramine maleate solutions was significantly higher than that in 50 mM KCL solutions. We confirmed that the bitter taste receptor T2R7 and downstream signaling effectors are sensitive to different concentrations of bitter compounds. Moreover, T2R7-1 (corresponding to the unique haplotype of the Tibetan chicken) had higher sensitivity to bitter compounds compared with that of T2R7-2 (corresponding to the unique haplotype of the Jiuyuan black-chicken). These results provide great significance of taste response on dietary intake to improve chicken feeding efficiency in poultry production and have certain reference value for future taste research in other bird species.
Copyright © 2019 Yuan Su et al.
Conflict of interest statement
The authors declare that they have no conflicts of interest.
Figures
Similar articles
-
Identification of functional bitter taste receptors and their antagonist in chickens.Biochem Biophys Res Commun. 2017 Jan 22;482(4):693-699. doi: 10.1016/j.bbrc.2016.11.096. Epub 2016 Nov 17. Biochem Biophys Res Commun. 2017. PMID: 27866985
-
Bitter taste receptor T2R7 and umami taste receptor subunit T1R1 are expressed highly in Vimentin-negative taste bud cells in chickens.Biochem Biophys Res Commun. 2019 Apr 2;511(2):280-286. doi: 10.1016/j.bbrc.2019.02.021. Epub 2019 Feb 16. Biochem Biophys Res Commun. 2019. PMID: 30782484 Free PMC article.
-
Plasticity of the ligand binding pocket in the bitter taste receptor T2R7.Biochim Biophys Acta Biomembr. 2018 May;1860(5):991-999. doi: 10.1016/j.bbamem.2018.01.014. Epub 2018 Feb 12. Biochim Biophys Acta Biomembr. 2018. PMID: 29355483
-
[Advances in bitterness receptors T2Rs in different diseases].Zhongguo Zhong Yao Za Zhi. 2024 Aug;49(16):4347-4358. doi: 10.19540/j.cnki.cjcmm.20240619.601. Zhongguo Zhong Yao Za Zhi. 2024. PMID: 39307772 Review. Chinese.
-
The bitterness of genitourinary infections: Properties, ligands of genitourinary bitter taste receptors and mechanisms linking taste sensing to inflammatory processes in the genitourinary tract.Eur J Obstet Gynecol Reprod Biol. 2020 Apr;247:101-110. doi: 10.1016/j.ejogrb.2020.02.015. Epub 2020 Feb 14. Eur J Obstet Gynecol Reprod Biol. 2020. PMID: 32088528 Review.
References
MeSH terms
Substances
LinkOut - more resources
Full Text Sources
Molecular Biology Databases
Miscellaneous
