

Network architecture strongly influences the fluid flow pattern through the lacunocanalicular network in human osteons
- PMID: 31782029
- PMCID: PMC7203595
- DOI: 10.1007/s10237-019-01250-1
Network architecture strongly influences the fluid flow pattern through the lacunocanalicular network in human osteons
Abstract
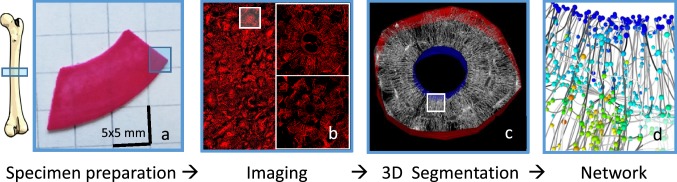
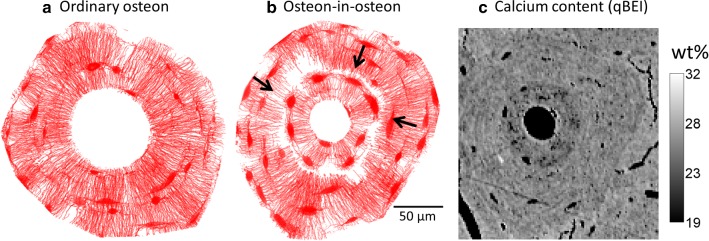
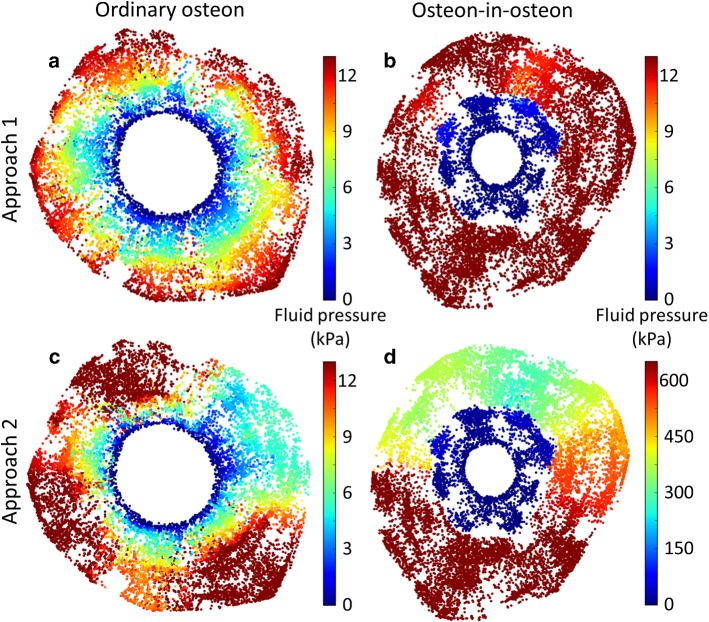
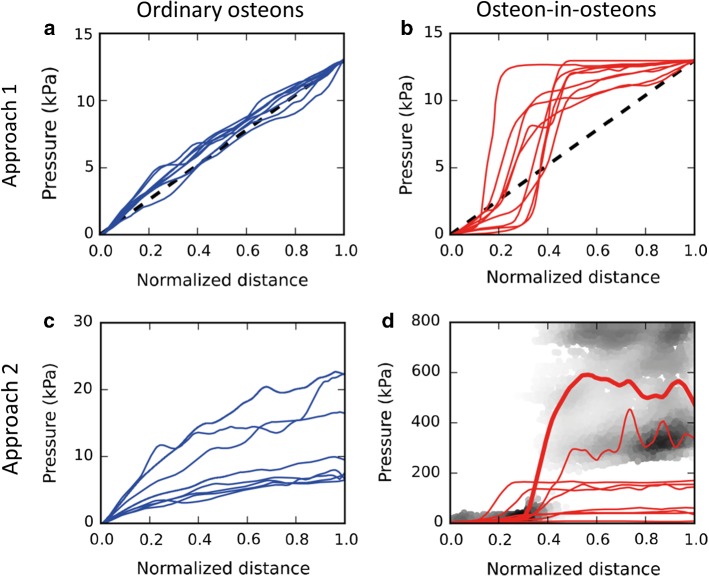
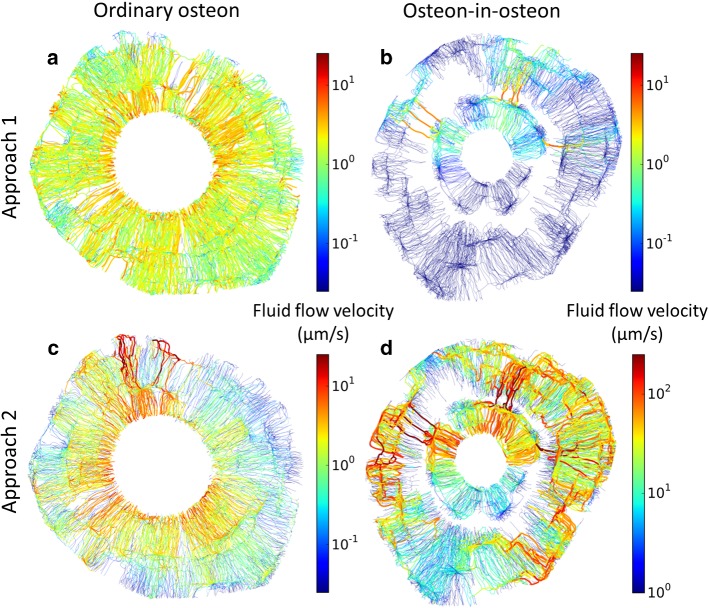
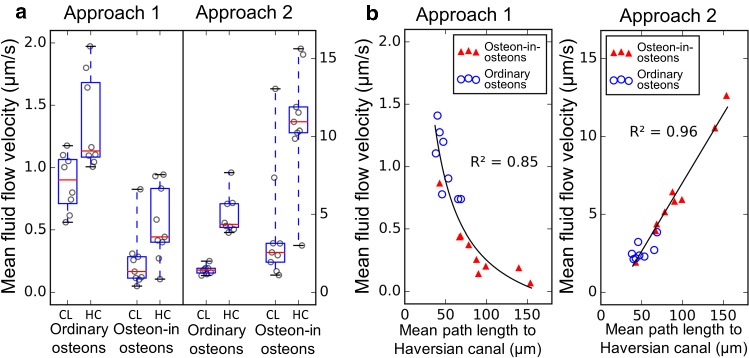
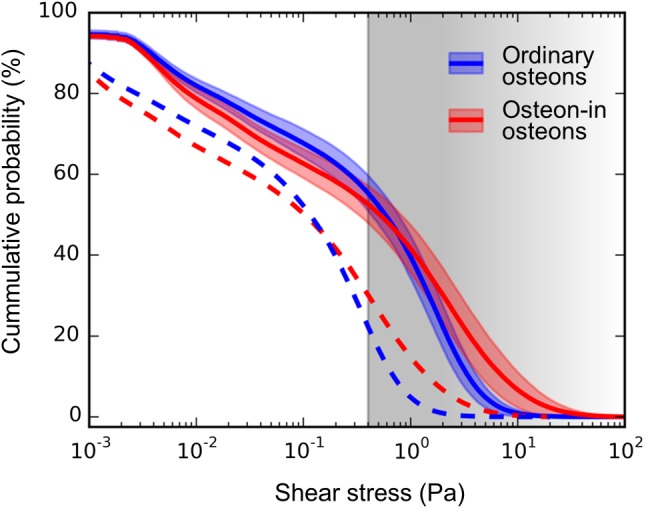
A popular hypothesis explains the mechanosensitivity of bone due to osteocytes sensing the load-induced flow of interstitial fluid squeezed through the lacunocanalicular network (LCN). However, the way in which the intricate structure of the LCN influences fluid flow through the network is largely unexplored. We therefore aimed to quantify fluid flow through real LCNs from human osteons using a combination of experimental and computational techniques. Bone samples were stained with rhodamine to image the LCN with 3D confocal microscopy. Image analysis was then performed to convert image stacks into mathematical network structures, in order to estimate the intrinsic permeability of the osteons as well as the load-induced fluid flow using hydraulic circuit theory. Fluid flow was studied in both ordinary osteons with a rather homogeneous LCN as well as a frequent subtype of osteons-so-called osteon-in-osteons-which are characterized by a ring-like zone of low network connectivity between the inner and the outer parts of these osteons. We analyzed 8 ordinary osteons and 9 osteon-in-osteons from the femur midshaft of a 57-year-old woman without any known disease. While the intrinsic permeability was 2.7 times smaller in osteon-in-osteons compared to ordinary osteons, the load-induced fluid velocity was 2.3 times higher. This increased fluid velocity in osteon-in-osteons can be explained by the longer path length, needed to cross the osteon from the cement line to the Haversian canal, including more fluid-filled lacunae and canaliculi. This explanation was corroborated by the observation that a purely structural parameter-the mean path length to the Haversian canal-is an excellent predictor for the average fluid flow velocity. We conclude that osteon-in-osteons may be particularly significant contributors to the mechanosensitivity of cortical bone, due to the higher fluid flow in this type of osteons.
Keywords: Canaliculi; Fluid flow; Human osteon; Lacuna; Lacunocanalicular network; Osteocyte.
Conflict of interest statement
The authors have nothing to declare, and there is no conflict of interest.
Figures
Similar articles
-
Coalignment of osteocyte canaliculi and collagen fibers in human osteonal bone.J Struct Biol. 2017 Sep;199(3):177-186. doi: 10.1016/j.jsb.2017.07.004. Epub 2017 Aug 1. J Struct Biol. 2017. PMID: 28778734
-
Morphometric analysis of osteonal architecture in bones from healthy young human male subjects using scanning electron microscopy.J Anat. 2013 Sep;223(3):242-54. doi: 10.1111/joa.12079. Epub 2013 Jul 8. J Anat. 2013. PMID: 23834434 Free PMC article.
-
Analysis of the effect of osteon diameter on the potential relationship of osteocyte lacuna density and osteon wall thickness.Anat Rec (Hoboken). 2011 Sep;294(9):1472-85. doi: 10.1002/ar.21452. Epub 2011 Aug 1. Anat Rec (Hoboken). 2011. PMID: 21809466 Free PMC article.
-
Osteon: Structure, Turnover, and Regeneration.Tissue Eng Part B Rev. 2022 Apr;28(2):261-278. doi: 10.1089/ten.TEB.2020.0322. Epub 2021 Mar 8. Tissue Eng Part B Rev. 2022. PMID: 33487116 Free PMC article. Review.
-
Towards a Connectomic Description of the Osteocyte Lacunocanalicular Network in Bone.Curr Osteoporos Rep. 2019 Aug;17(4):186-194. doi: 10.1007/s11914-019-00515-z. Curr Osteoporos Rep. 2019. PMID: 31093871 Free PMC article. Review.
Cited by
-
Finite Element Models of Osteocytes and Their Load-Induced Activation.Curr Osteoporos Rep. 2022 Apr;20(2):127-140. doi: 10.1007/s11914-022-00728-9. Epub 2022 Mar 17. Curr Osteoporos Rep. 2022. PMID: 35298773 Free PMC article. Review.
-
Effects of Osteocyte Shape on Fluid Flow and Fluid Shear Stress of the Loaded Bone.Biomed Res Int. 2022 May 30;2022:3935803. doi: 10.1155/2022/3935803. eCollection 2022. Biomed Res Int. 2022. PMID: 35677099 Free PMC article.
-
Using confocal imaging approaches to understand the structure and function of osteocytes and the lacunocanalicular network.Bone. 2020 Sep;138:115463. doi: 10.1016/j.bone.2020.115463. Epub 2020 Jun 6. Bone. 2020. PMID: 32512167 Free PMC article. Review.
-
The mechanoresponse of bone is closely related to the osteocyte lacunocanalicular network architecture.Proc Natl Acad Sci U S A. 2020 Dec 22;117(51):32251-32259. doi: 10.1073/pnas.2011504117. Epub 2020 Dec 7. Proc Natl Acad Sci U S A. 2020. PMID: 33288694 Free PMC article.
-
Deep learning to overcome Zernike phase-contrast nanoCT artifacts for automated micro-nano porosity segmentation in bone.J Synchrotron Radiat. 2024 Jan 1;31(Pt 1):136-149. doi: 10.1107/S1600577523009852. Epub 2024 Jan 1. J Synchrotron Radiat. 2024. PMID: 38095668 Free PMC article.
References
-
- Anderson EJ, Kreuzer SM, Small O, Tate MLK. Pairing computational and scaled physical models to determine permeability as a measure of cellular communication in micro- and nano-scale pericellular spaces. Microfluid Nanofluid. 2008;4:193–204. doi: 10.1007/s10404-007-0156-5. - DOI
-
- Andreasen CM, Delaisse JM, van der Eerden BCJ, van Leeuwen JPTM, Ding M, Andersen TL. Understanding age-induced cortical porosity in women: the accumulation and coalescence of eroded cavities upon existing intracortical canals is the main contributor. J Bone Miner Res. 2018;33:606–620. doi: 10.1002/jbmr.3354. - DOI - PubMed
MeSH terms
Substances
Grants and funding
LinkOut - more resources
Full Text Sources
Miscellaneous
