Development of A Fission Yeast Cell-Based Platform for High Throughput Screening of HIV-1 Protease Inhibitors
- PMID: 31782368
- PMCID: PMC9648856
- DOI: 10.2174/1570162X17666191128102839
Development of A Fission Yeast Cell-Based Platform for High Throughput Screening of HIV-1 Protease Inhibitors
Abstract
Background: HIV-1 protease inhibitor (PI) is one of the most potent classes of drugs in combinational antiretroviral therapies (cART). When a PI is used in combination with other anti- HIV drugs, cART can often suppress HIV-1 below detection thus prolonging the patient's lives. However, the challenge often faced by patients is the emergence of HIV-1 drug resistance. Thus, PIs with high genetic-barrier to drug-resistance are needed.
Objective: The objective of this study was to develop a novel and simple fission yeast (Schizosaccharomyces pombe) cell-based system that is suitable for high throughput screening (HTS) of small molecules against HIV-1 protease (PR).
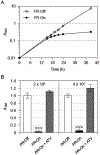
Methods: A fission yeast RE294-GFP strain that stably expresses HIV-1 PR and green fluorescence protein (GFP) under the control of an inducible nmt1 promoter was used. Production of HIV-1 PR induces cellular growth arrest, which was used as the primary endpoint for the search of PIs and was quantified by an absorbance-based method. Levels of GFP production were used as a counter-screen control to eliminate potential transcriptional nmt1 inhibitors.
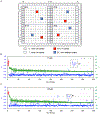
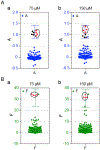
Results: Both the absorbance-based HIV-1 PR assay and the GFP-based fluorescence assay were miniaturized and optimized for HTS. A pilot study was performed using a small drug library mixed with known PI drugs and nmt1 inhibitors. With empirically adjusted and clearly defined double-selection criteria, we were able to correctly identify the PIs and to exclude all hidden nmt1 inhibitors.
Conclusion: We have successfully developed and validated a fission yeast cell-based HTS platform for the future screening and testing of HIV-1 PR inhibitors.
Keywords: HIV-1 protease (PR); HIV-1 protease inhibitor (PI); atazanavir (ATV); fission yeast (Schizosaccharomyces pombe); green fluorescence protein (GFP); high throughput screening (HTS); transcriptional nmt1 inhibitor (TNI)..
Copyright© Bentham Science Publishers; For any queries, please email at epub@benthamscience.net.
Conflict of interest statement
CONFLICT OF INTEREST
The authors declare no conflict of interest, financial or otherwise.
Figures


Similar articles
-
Single-Agent and Fixed-Dose Combination HIV-1 Protease Inhibitor Drugs in Fission Yeast (Schizosaccharomyces pombe).Pathogens. 2021 Jun 24;10(7):804. doi: 10.3390/pathogens10070804. Pathogens. 2021. PMID: 34202872 Free PMC article.
-
HIV-1 Protease in the Fission Yeast Schizosaccharomyces pombe.PLoS One. 2016 Mar 16;11(3):e0151286. doi: 10.1371/journal.pone.0151286. eCollection 2016. PLoS One. 2016. PMID: 26982200 Free PMC article.
-
Non-infectious fluorimetric assay for phenotyping of drug-resistant HIV proteinase mutants.J Clin Virol. 2006 May;36(1):50-9. doi: 10.1016/j.jcv.2006.01.014. Epub 2006 Mar 9. J Clin Virol. 2006. PMID: 16527535
-
Lopinavir/ritonavir: a review of its use in the management of HIV infection.Drugs. 2003;63(8):769-802. doi: 10.2165/00003495-200363080-00004. Drugs. 2003. PMID: 12662125 Review.
-
Protease Inhibitors for the Treatment of HIV/AIDS: Recent Advances and Future Challenges.Curr Top Med Chem. 2019;19(18):1571-1598. doi: 10.2174/1568026619666190619115243. Curr Top Med Chem. 2019. PMID: 31237209 Review.
Cited by
-
SARS-CoV-2 ORF3a Protein as a Therapeutic Target against COVID-19 and Long-Term Post-Infection Effects.Pathogens. 2024 Jan 14;13(1):75. doi: 10.3390/pathogens13010075. Pathogens. 2024. PMID: 38251382 Free PMC article. Review.
-
Advanced Protocol for Molecular Characterization of Viral Genome in Fission Yeast (Schizosaccharomyces pombe).Pathogens. 2024 Jul 4;13(7):566. doi: 10.3390/pathogens13070566. Pathogens. 2024. PMID: 39057793 Free PMC article.
-
A mechanism of salt bridge-mediated resistance to FtsZ inhibitor PC190723 revealed by a cell-based screen.Mol Biol Cell. 2023 Mar 1;34(3):ar16. doi: 10.1091/mbc.E22-12-0538. Epub 2023 Jan 18. Mol Biol Cell. 2023. PMID: 36652338 Free PMC article.
-
Improving Drug Sensitivity of HIV-1 Protease Inhibitors by Restriction of Cellular Efflux System in a Fission Yeast Model.Pathogens. 2022 Jul 16;11(7):804. doi: 10.3390/pathogens11070804. Pathogens. 2022. PMID: 35890048 Free PMC article.
-
Single-Agent and Fixed-Dose Combination HIV-1 Protease Inhibitor Drugs in Fission Yeast (Schizosaccharomyces pombe).Pathogens. 2021 Jun 24;10(7):804. doi: 10.3390/pathogens10070804. Pathogens. 2021. PMID: 34202872 Free PMC article.
References
-
- UNAIDS. Global HIV & AIDS statistics fact sheet UNAIDS Report 2019.
Publication types
MeSH terms
Substances
Grants and funding
LinkOut - more resources
Full Text Sources
Research Materials
Miscellaneous

