

PHF6 promotes non-homologous end joining and G2 checkpoint recovery
- PMID: 31782600
- PMCID: PMC6944915
- DOI: 10.15252/embr.201948460
PHF6 promotes non-homologous end joining and G2 checkpoint recovery
Abstract
The cellular response to DNA breaks is influenced by chromatin compaction. To identify chromatin regulators involved in the DNA damage response, we screened for genes that affect recovery following DNA damage using an RNAi library of chromatin regulators. We identified genes involved in chromatin remodeling, sister chromatid cohesion, and histone acetylation not previously associated with checkpoint recovery. Among these is the PHD finger protein 6 (PHF6), a gene mutated in Börjeson-Forssman-Lehmann syndrome and leukemic cancers. We find that loss of PHF6 dramatically compromises checkpoint recovery in G2 phase cells. Moreover, PHF6 is rapidly recruited to sites of DNA lesions in a PARP-dependent manner and required for efficient DNA repair through classical non-homologous end joining. These results indicate that PHF6 is a novel DNA damage response regulator that promotes end joining-mediated repair, thereby stimulating timely recovery from the G2 checkpoint.
Keywords: NHEJ; PHF6; checkpoint recovery; chromatin regulators; siRNA screen.
© 2019 The Authors. Published under the terms of the CC BY 4.0 license.
Conflict of interest statement
The authors declare that they have no conflict of interest.
Figures
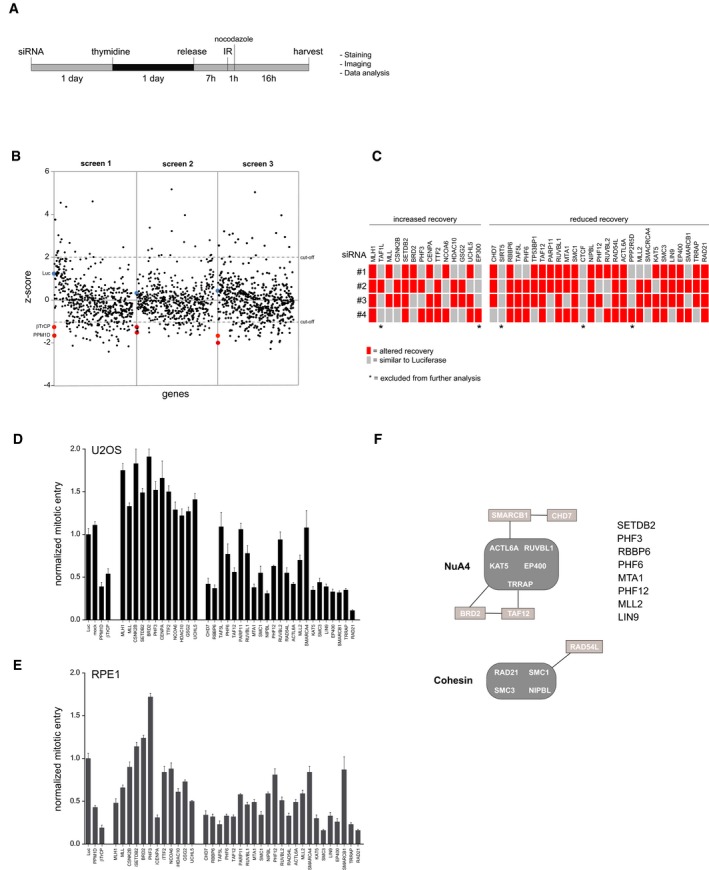
- A
Experimental setup used to screen for chromatin regulators involved in the IR‐induced G2 checkpoint response and recovery. Unless stated otherwise, 5 Gy of IR was used.
- B
Results of three independent microscopy‐based screens in U2OS cells. Knockdown of luciferase (blue) and the positive controls PPM1D and βTrCP (red) are indicated. A low/high Z‐score indicates less/more phospho‐histone H3 positive cells compared with the control, reflecting reduced/increased numbers of cells going into mitosis in the respective knockdowns after 5 Gy of IR.
- C
Deconvolution of the 41 primary hits in U2OS cells by four separate siRNA oligonucleotides. Gray represents a recovery value that is similar to the luciferase control (< 0.5 SD), and the red represents an altered recovery value (> 0.5 SD) in two independent experiments.
- D, E
U2OS cells (D) and RPE1 hTert immortalized primary epithelial cells (E) were transfected with siRNA oligos targeting the hits in a similar setup as described in A), but now analyzed for mitotic entry by MPM2 and PI staining by flow cytometry. For normalization, see Materials and Methods. Error bars represent the SEM of three independent experiments.
- F
Graphical explanation of the known interactions between the identified hits through STRING pathway analysis.
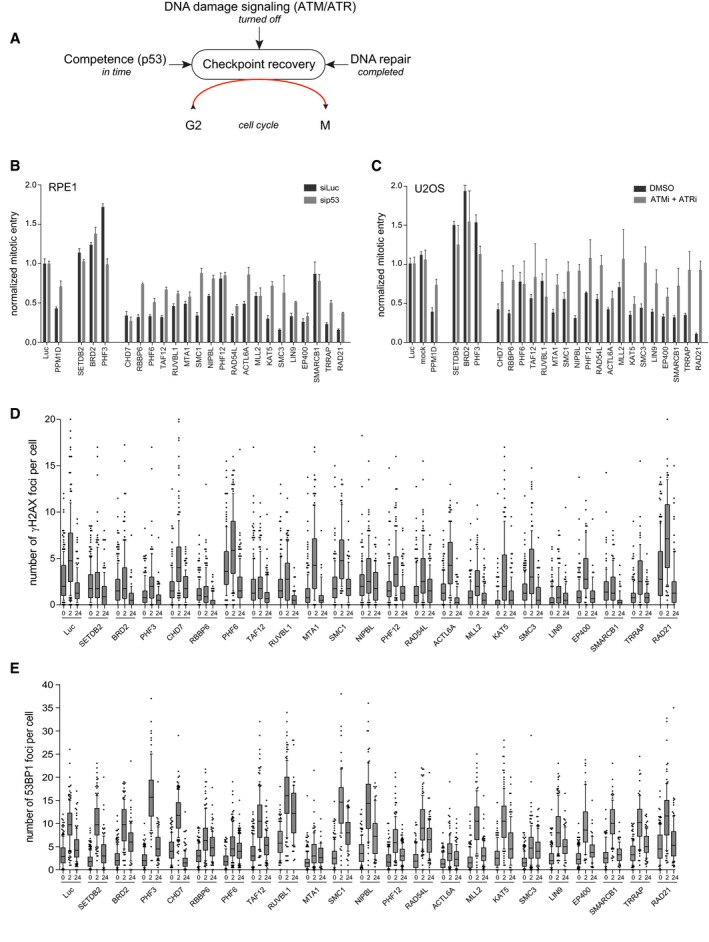
- A
Overview of the cellular mechanisms that influence DNA damage‐induced G2 checkpoint recovery.
- B
RPE1 cells were depleted for p53 in combination with the indicated proteins by siRNA, in conditions used for the primary screen (2 Gy of IR). Mitotic entry was analyzed by MPM2 and PI staining by flow cytometry. For normalization, see Materials and Methods. Error bars represent the SEM of three independent experiments.
- C
U2OS cells were transfected with the indicated siRNA oligonucleotides in a setup similar to the primary screen, but with 10 Gy of IR and in the presence of ATM and ATR inhibitors. Mitotic entry was analyzed by MPM2 and PI staining by flow cytometry. For normalization, see Materials and Methods. Error bars represent the SEM of three independent experiments.
- D, E
U2OS cells were transfected with the indicated siRNA oligos using the protocol of the primary screen and fixed for immunofluorescence after 0, 2, and 24 h after 5 Gy IR. Samples were stained with antibodies for γH2AX (D) or 53BP1 (E) and analyzed through automated confocal microscopy and specifically developed image analysis software. From one experiment, two to four separate images with a total of at least 100 cells were analyzed for each knockdown. Shown is the number of γH2AX (D) and 53BP1 (E) foci per cell. In the box plots, the median with the first and third quartile is indicated, and the whiskers are drawn down to the 10th percentile and up to the 90th.
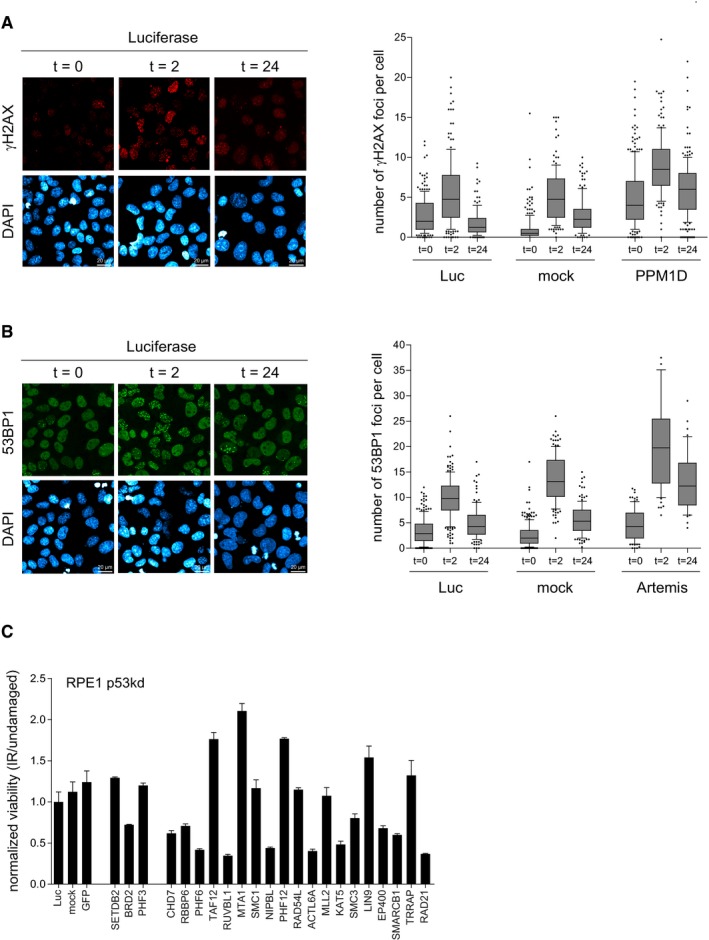
Positive control for Fig 2D. U2OS cells were mock depleted or depleted for Luc or PPM1D. Next, cells were synchronized in G2, irradiated, and fixed for immunofluorescence for γH2AX after 0, 2, and 24 h. Scale bar is 20 μm. From one experiment, four separate images with a total of at least 100 cells were analyzed for each knockdown. The quantification shows the number of γH2AX foci per cell. In the box plots, the median with the first and third quartile is indicated, and the whiskers are drawn down to the 10th percentile and up to the 90th.
Positive control for Fig 2E. U2OS cells were mock depleted or depleted for Luc or Artemis. Next, cells were synchronized in G2, irradiated, and fixed for immunofluorescence for 53BP1 after 0, 2, and 24 h. Scale bar is 20 μm. From one experiment, four separate images with a total of at least 100 cells were analyzed for each knockdown. The quantification shows the number of 53BP1 foci per cell. In the box plots, the median with the first and third quartile is indicated, and the whiskers are drawn down to the 10th percentile and up to the 90th.
RPE1 cells were depleted for p53 in combination with the individual candidates. Cells were left untreated or irradiated with 4 Gy and incubated for 10 days after which the colonies were analyzed. Experiments were performed in triplicate and two independent times. Error bars represent 95% confidence interval (CI).
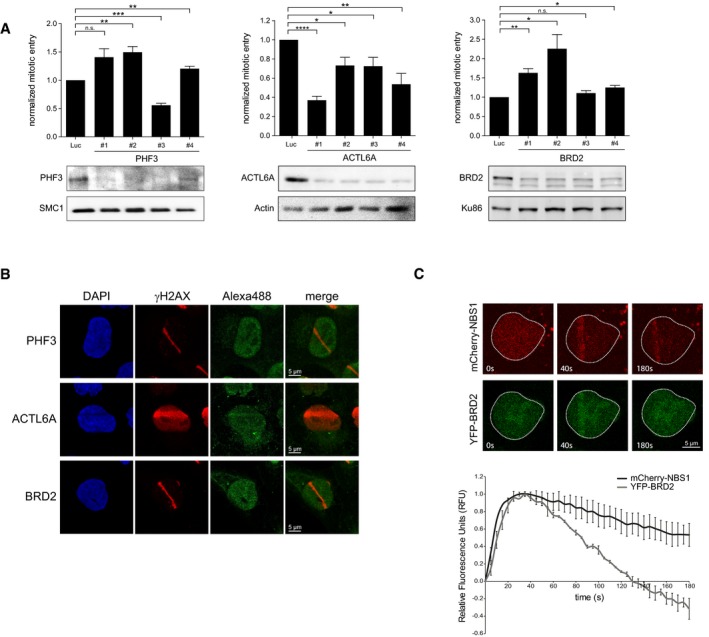
U2OS cells were depleted for PHF3, BRD2, and ACTL6A and prepared for analysis by flow cytometry to determine checkpoint recovery (top panels) or lysed for Western blotting using the indicated antibodies (bottom panels). Error bars represent the SEM of three independent experiments. Statistical significance was determined using a two‐tailed, unpaired t‐test (*P < 0.05, **P < 0.01, ***P < 0.001, ****P < 0.0001).
U2OS cells were locally irradiated using a 405nm laser and fixed directly thereafter for immunofluorescence. Alexa 488 represents PHF3, ACTL6A, or BRD2 staining. Scale bar is 5 μm.
U2OS cells expressing YPF‐BRD2 and mCherry‐NBS1 were locally irradiated and followed by time‐lapse imaging. Graph shows the quantifications of at least 30 cells analyzed in three individual experiments, and error bars represent the SD. Scale bar is 5 μm.
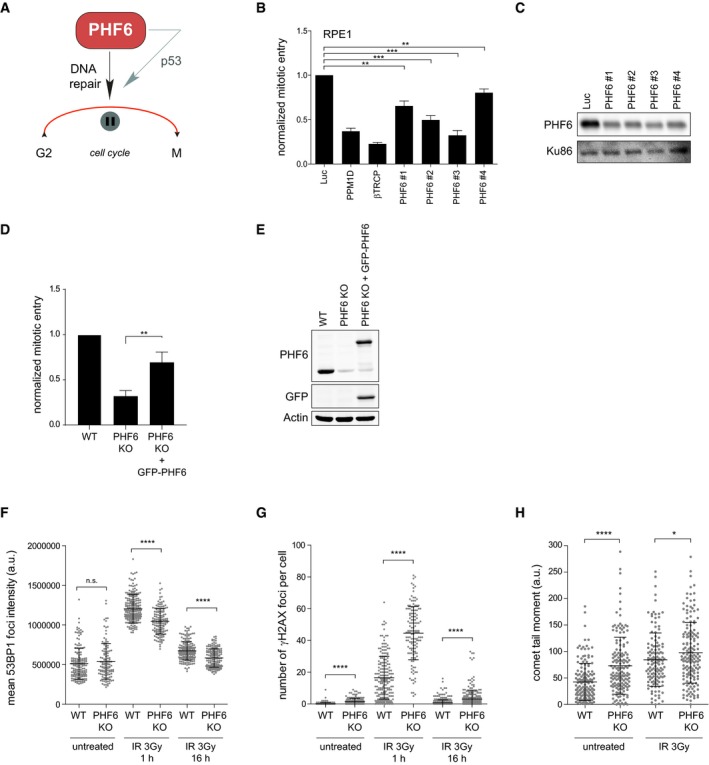
- A
Graphical explanation of the effect of PHF6 on checkpoint recovery through DNA repair and p53.
- B, C
U2OS cells were transfected with four different siRNA oligonucleotides targeting PHF6, synchronized in G2, and subsequent recovery after 5 Gy of IR and the addition of nocodazole were analyzed by flow cytometry with MPM2 staining (B), or cells were lysed and analyzed using Western blotting with the indicated antibodies (C). PPM1D and βTrCP were used as positive controls. Error bars represent the SEM of three independent experiments. Statistical significance was determined using a two‐tailed, unpaired t‐test (**P < 0.01, ***P < 0.001).
- D, E
U2OS WT, PHF6 knockout, and PHF6 knockout cells that were reconstituted with GFP‐PHF6 were synchronized in G2, and recovery was determined after 2 Gy of IR using flow cytometry with pHH3 staining (D), or cells were lysed and analyzed using Western blotting with the indicated antibodies (E). Error bars represent the SEM of three independent experiments. Statistical significance was determined using a two‐tailed, unpaired t‐test (**P < 0.01). The remaining PHF6 signal in the PHF6 KO sample (E) is likely due to a crossreaction at similar height as PHF6 (also see Fig EV3C).
- F, G
U2OS WT and PHF6 knockout cells were irradiated using 3 Gy of IR, and cells were fixed at different time points for immunofluorescence. In (F) is presented 53BP1 IRIF intensity. In (G) is shown the number of γH2AX foci per cell. Error bars represent the SD of three independent experiments. Statistical significance was determined using a two‐tailed, unpaired t‐test (****P < 0.0001).
- H
U2OS WT and PHF6 knockout cells were left untreated or irradiated with 3 Gy and processed after 1 h for comet assay analysis. The comet tail moment was analyzed in at least 50 individual cells. Error bars represent the SD of three independent experiments. Statistical significance was determined using a two‐tailed, unpaired t‐test (*P < 0.05, ****P < 0.0001).
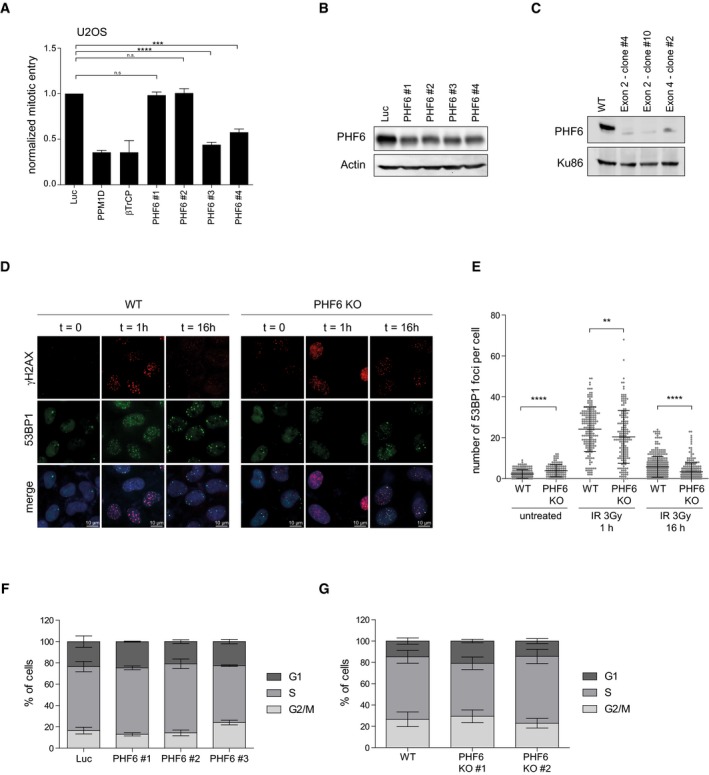
- A, B
RPE1 cells were depleted of PHF6 using four different siRNA oligonucleotides. Checkpoint recovery after 5 Gy was analyzed by staining for MPM2 and flow cytometry (A), or cells were lysed and analyzed using Western blotting with the indicated antibodies (B). Error bars represent the SEM of three independent experiments. Statistical significance was determined using a two‐tailed, unpaired t‐test (***P < 0.001, ****P < 0.0001).
- C
U2OS WT and three different PHF6 knockout clones were lysed and analyzed by Western blotting with the indicated antibodies.
- D
U2OS WT and PHF6 knockout cells were irradiated at 2 Gy and fixed for immunofluorescence at 0, 1, and 16 h. Samples were stained with the indicated antibodies. Scale bar is 10 μm.
- E
Quantification of number of 53BP1 IRIF per cell of (D) in which the error bars represent the SD of three independent experiments. Statistical significance was determined using a two‐tailed, unpaired t‐test (**P < 0.01, ****P < 0.0001).
- F
U2OS cells were depleted of PHF6 with three different siRNA oligonucleotides. Cells were fixed, stained with propidium iodide, and analyzed by flow cytometry. Cell cycle distribution was determined using Flowlogic software. Error bars represent the SD of three independent experiments.
- G
U2OS WT and two different PHF6 knockout cell lines were fixed, stained with propidium iodide, and analyzed by flow cytometry. Cell cycle distribution was determined using Flowlogic software. Error bars represent the SD of three independent experiments.
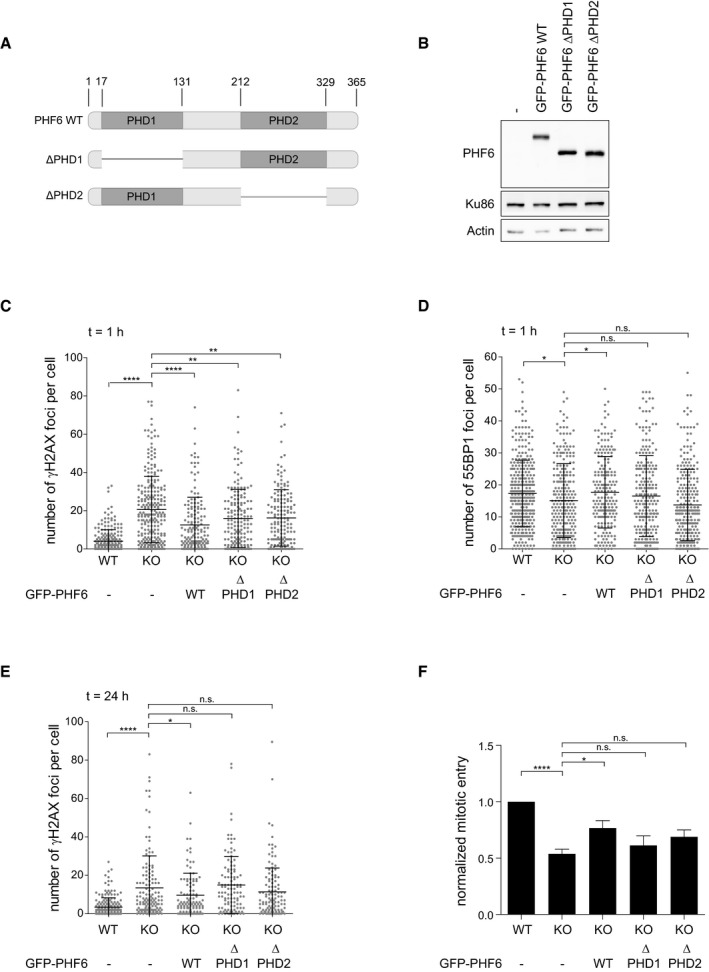
- A
Graphical explanation of the PHD domains in PHF6 and the PHD1 and PHD2 deletion mutants (∆PHD1 and ∆PHD2) generated for these studies.
- B
U2OS PHF6 knockout (KO) cells complemented with GFP‐PHF6 wild type (GFP‐PHF6 WT) or mutants lacking either the PHD1 (GFP‐PHF6 ∆PHD1) or PHD2 (GFP‐PHF6 ∆PHD2) domain were lysed and analyzed using Western blotting with the indicated antibodies.
- C–E
U2OS WT, PHF6 KO, or PHF6 KO cells complemented with GFP‐PHF6 WT, GFP‐PHF6 ∆PHD1, or GFP‐PHF6 ∆PHD2 were irradiated using 3 Gy of IR and fixed after 1 h (C, D) or 24 h (E) for immunofluorescence. Presented is the number of γH2AX (C, E) or 53BP1 (D) foci per cell. Error bars represent the SD of three independent experiments. Statistical significance was determined using a two‐tailed, unpaired t‐test (*P < 0.05, **P < 0.01, ****P < 0.0001).
- F
U2OS WT, PHF6 KO, and PHF6 KO cells transfected with GFP‐PHF6 WT, GFP‐PHF6 ∆PHD1, or GFP‐PHF6 ∆PHD2 were synchronized in G2, treated with etoposide (3 μM) for 1 h and then with nocodazole for 16 h. Subsequent recovery was analyzed by flow cytometry with MPM2 staining. Error bars represent the SEM of five independent experiments. Statistical significance was determined using a two‐tailed, unpaired t‐test (*P < 0.05, ****P < 0.0001).
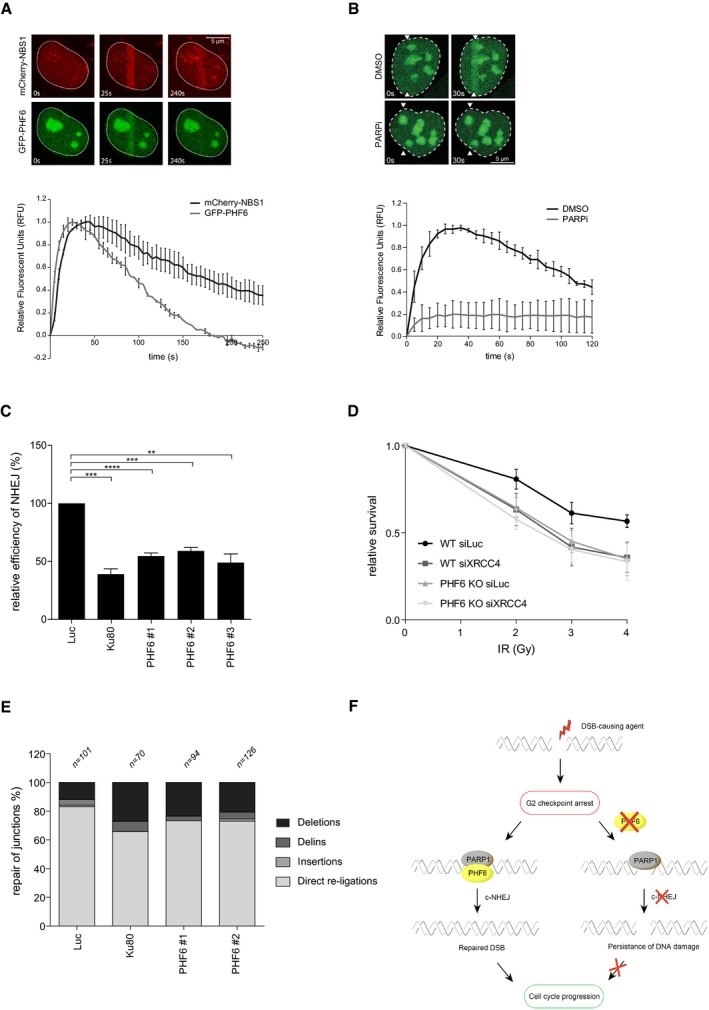
- A, B
U2OS cells stably expressing GFP‐PHF6 and mCherry‐NBS1 were laser‐irradiated, and cells were analyzed by time‐lapse imaging. In (B), the PARP inhibitor Olaparib was added 30 min before laser‐induced damage. At least 60 cells were analyzed in three individual experiments, and error bars represent the SD (lower panel). Scale bar is 5 μm.
- C
GC92 SV40 immortalized human fibroblasts containing the I‐SceI NHEJ reporter were transfected with the indicated siRNA oligos and I‐SceI. 48 h later, the cells were fixed and analyzed by flow cytometry. Represented is the relative repair efficiency as compared to the Luciferase control. Error bars represent the SEM of three independent experiments. Statistical significance was determined using a two‐tailed, unpaired t‐test (**P < 0.01, ***P < 0.001).
- D
Clonogenic survival assays of U2OS WT and PHF6 knockout cells that were depleted for luciferase or XRCC4 and treated with 2, 3, or 4 Gy IR. Shown is the relative survival as compared to the undamaged control. Error bars represent the SEM of three individual experiments.
- E
GC92 SV40 immortalized human fibroblasts containing the I‐SceI NHEJ reporter were transfected with the indicated siRNA oligos and I‐SceI. 48 h later, genomic DNA was extracted and repair of I‐SceI cut sites analyzed through junction analysis (n = independently derived sequences, see Materials and Methods for details).
- F
Model showing early recruitment of PHF6 to DNA DSBs in a PARP1/2‐dependent manner, possibly to remodel the chromatin for efficient DNA repair through classical NHEJ and thereby to promote recovery from the G2 checkpoint arrest.
- A, B
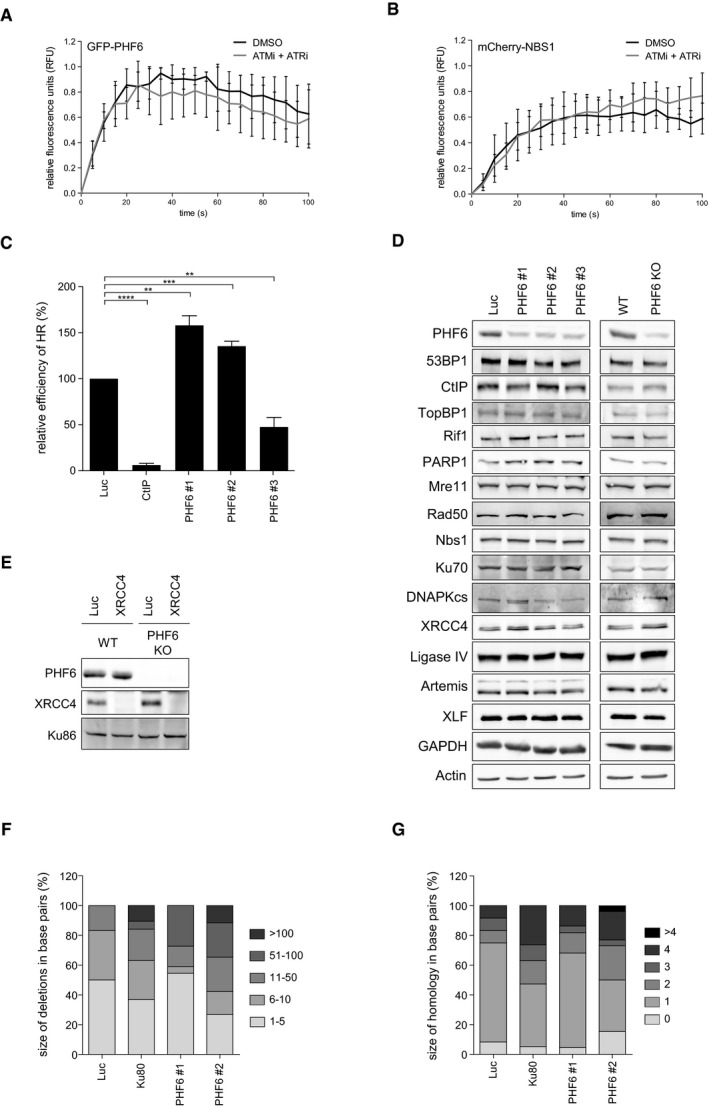
U2OS cells expressing GFP‐PHF6 and mCherry‐NBS1 were locally irradiated in the absence and presence of ATM and ATR inhibitors. Shown is the recruitment of GFP‐PHF6 (A) or mCherry‐NBS1 (B) to laser‐induced breaks in time. At least 30 cells were analyzed in three individual experiments, and error bars represent the SD.
- C
U2OS‐DR cells containing the I‐SceI HR reporter were transfected with the indicated siRNA oligos and I‐SceI. 48 h later, the cells were fixed and analyzed by flow cytometry. Represented is the relative repair efficiency as compared to the Luciferase control. Error bars represent the SEM of three independent experiments. Statistical significance was determined using a two‐tailed, unpaired t‐test (**P < 0.01, ***P < 0.001, ****P < 0.0001).
- D
U2OS cells depleted of PHF6 with three different siRNA oligonucleotides and U2OS WT and PHF6 knockout cells were lysed and analyzed using Western blotting with the indicated antibodies.
- E
U2OS WT and PHF6 knockout cells transfected with siRNA oligos against luciferase or XRCC4 were lysed and analyzed using Western blotting with the indicated antibodies. The remaining PHF6 signal in the PHF6 KO sample is likely due to a cross reaction at similar height as PHF6 (also see Fig EV3C).
- F, G
Distribution of the deletion sizes (F) or the extent of microhomology for the category simple deletions (G) obtained from independently obtained I‐SceI repair events (described in Fig 4E) in the indicated samples.
Similar articles
-
Chromatin regulators and their impact on DNA repair and G2 checkpoint recovery.Cell Cycle. 2020 Sep;19(17):2083-2093. doi: 10.1080/15384101.2020.1796037. Epub 2020 Jul 30. Cell Cycle. 2020. PMID: 32730133 Free PMC article. Review.
-
Structural and functional insights into the human Börjeson-Forssman-Lehmann syndrome-associated protein PHF6.J Biol Chem. 2014 Apr 4;289(14):10069-83. doi: 10.1074/jbc.M113.535351. Epub 2014 Feb 19. J Biol Chem. 2014. PMID: 24554700 Free PMC article.
-
Pathogenesis of Börjeson-Forssman-Lehmann syndrome: Insights from PHF6 function.Neurobiol Dis. 2016 Dec;96:227-235. doi: 10.1016/j.nbd.2016.09.011. Epub 2016 Sep 12. Neurobiol Dis. 2016. PMID: 27633282 Free PMC article. Review.
-
Requirement for Parp-1 and DNA ligases 1 or 3 but not of Xrcc1 in chromosomal translocation formation by backup end joining.Nucleic Acids Res. 2014 Jun;42(10):6380-92. doi: 10.1093/nar/gku298. Epub 2014 Apr 19. Nucleic Acids Res. 2014. PMID: 24748665 Free PMC article.
-
A case report of PHF6 mosaicism: Beyond the classic Börjeson-Forssman-Lehmann syndrome.Pediatr Dermatol. 2021 Jul;38(4):919-925. doi: 10.1111/pde.14636. Epub 2021 May 26. Pediatr Dermatol. 2021. PMID: 34041787
Cited by
-
Functional mapping of PHF6 complexes in chromatin remodeling, replication dynamics, and DNA repair.Blood. 2022 Jun 9;139(23):3418-3429. doi: 10.1182/blood.2021014103. Blood. 2022. PMID: 35338774 Free PMC article.
-
PHF6 suppresses self-renewal of leukemic stem cells in AML.Leukemia. 2024 Sep;38(9):1938-1948. doi: 10.1038/s41375-024-02340-5. Epub 2024 Jul 14. Leukemia. 2024. PMID: 39004675 Free PMC article.
-
Leukemia-mutated proteins PHF6 and PHIP form a chromatin complex that represses acute myeloid leukemia stemness.bioRxiv [Preprint]. 2024 Dec 18:2024.11.29.625909. doi: 10.1101/2024.11.29.625909. bioRxiv. 2024. Update in: Genes Dev. 2025 Jul 28. doi: 10.1101/gad.352602.125. PMID: 39677666 Free PMC article. Updated. Preprint.
-
Loss of PHF6 leads to aberrant development of human neuron-like cells.Sci Rep. 2020 Nov 4;10(1):19030. doi: 10.1038/s41598-020-75999-2. Sci Rep. 2020. PMID: 33149206 Free PMC article.
-
Leukemia mutated proteins PHF6 and PHIP form a chromatin complex that represses acute myeloid leukemia stemness.Genes Dev. 2025 Jul 28:10.1101/gad.352602.125. doi: 10.1101/gad.352602.125. Online ahead of print. Genes Dev. 2025. PMID: 40721297 Free PMC article.
References
-
- Hanahan D, Weinberg RA (2000) The hallmarks of cancer. Cell 100: 57–70 - PubMed
-
- Aguilera A, Gomez‐Gonzalez B (2008) Genome instability: a mechanistic view of its causes and consequences. Nat Rev Genet 9: 204–217 - PubMed
-
- Abraham RT (2001) Cell cycle checkpoint signaling through the ATM and ATR kinases. Genes Dev 15: 2177–2196 - PubMed
-
- Matsuoka S, Ballif BA, Smogorzewska A, McDonald ER III, Hurov KE, Luo J, Bakalarski CE, Zhao Z, Solimini N, Lerenthal Y et al (2007) ATM and ATR substrate analysis reveals extensive protein networks responsive to DNA damage. Science 316: 1160–1166 - PubMed
Publication types
MeSH terms
Substances
Grants and funding
- Cancer Center Amsterdam/International
- SAF2016-80626/Ministerio de Ciencia, Innovacion y Universidades/International
- BFU2017-90889-REDT/Ministerio de Ciencia, Innovacion y Universidades/International
- TESIS2015010066/Agencia Canaria de Investigación, Innovación y Sociedad de la Información del Gobierno De Canarias/International
- VICI grant/Netherlands Organisation for Scientific Research/International
LinkOut - more resources
Full Text Sources
Research Materials
