. 2020 Feb;113(2):504-520.
doi: 10.1111/mmi.14436. Epub 2019 Dec 16.

Small RNA Mcr11 requires the transcription factor AbmR for stable expression and regulates genes involved in the central metabolism of Mycobacterium tuberculosis

Affiliations

Small RNA Mcr11 requires the transcription factor AbmR for stable expression and regulates genes involved in the central metabolism of Mycobacterium tuberculosis

Roxie C Girardin et al. Mol Microbiol. 2020 Feb.

Abstract

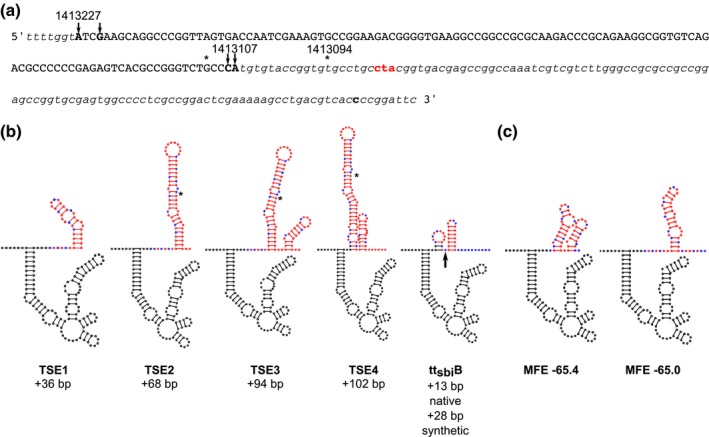
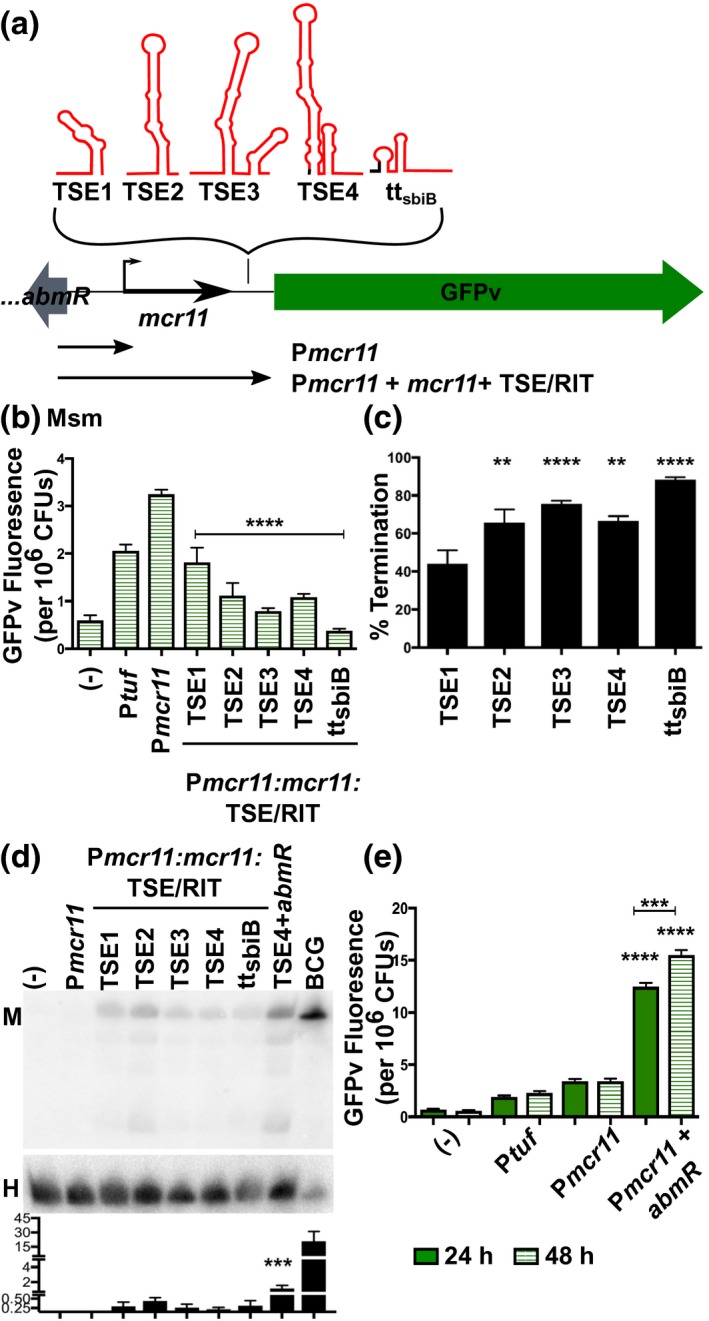
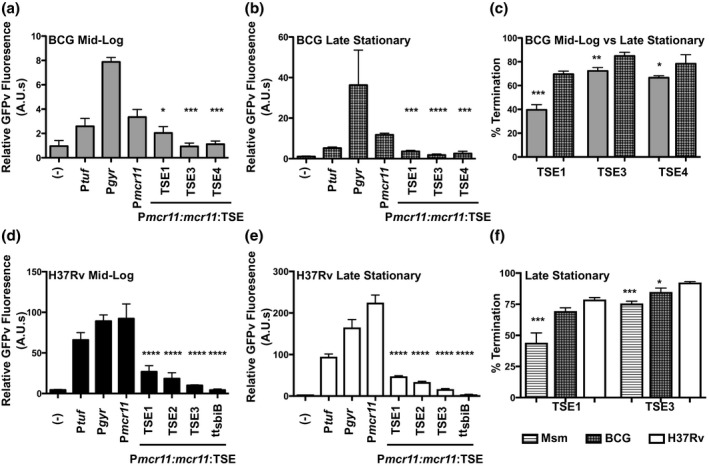
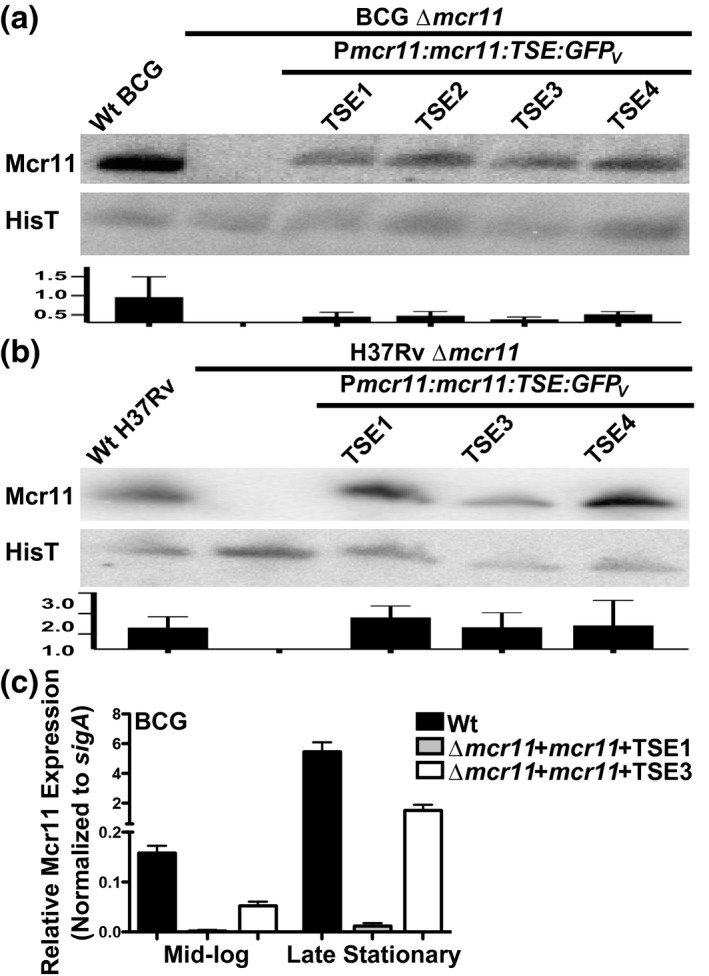
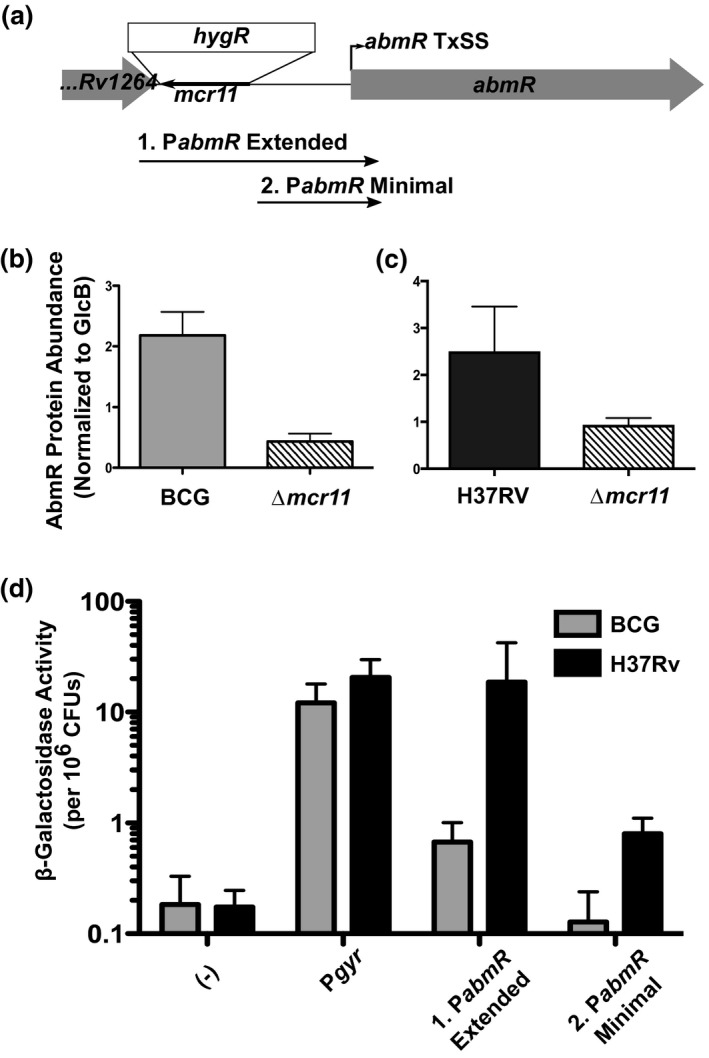
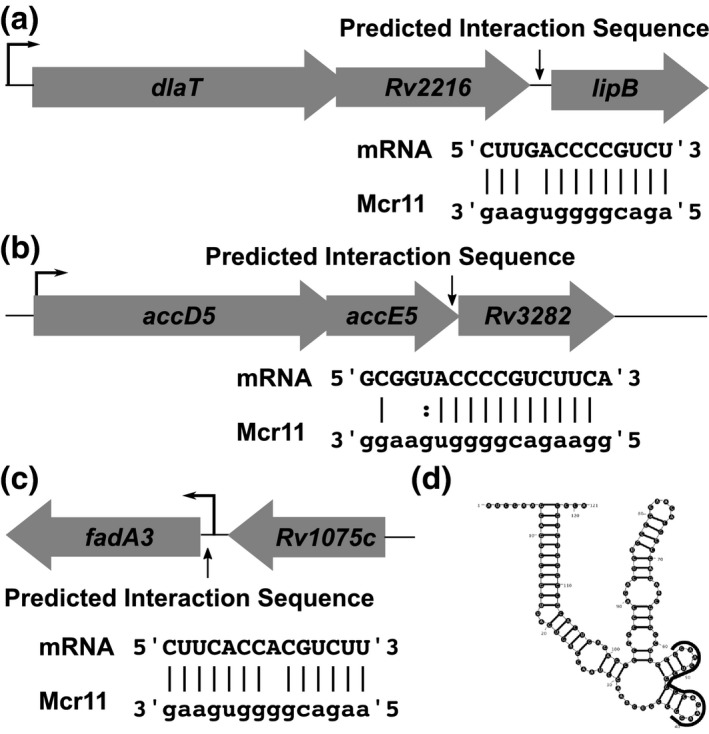
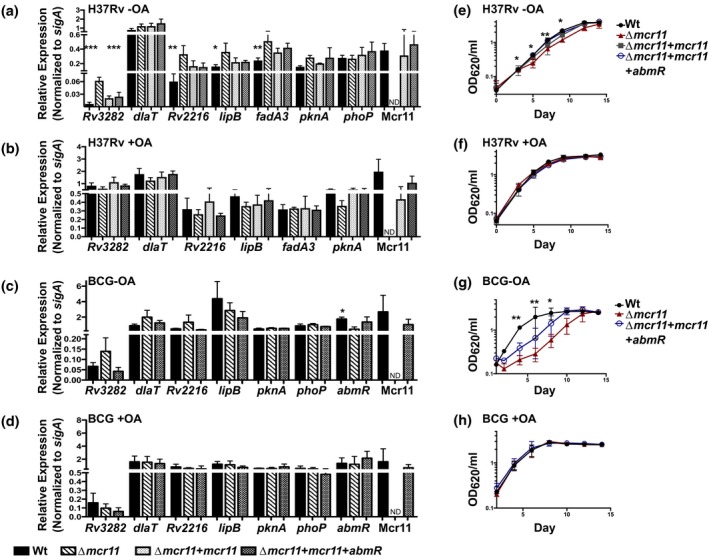
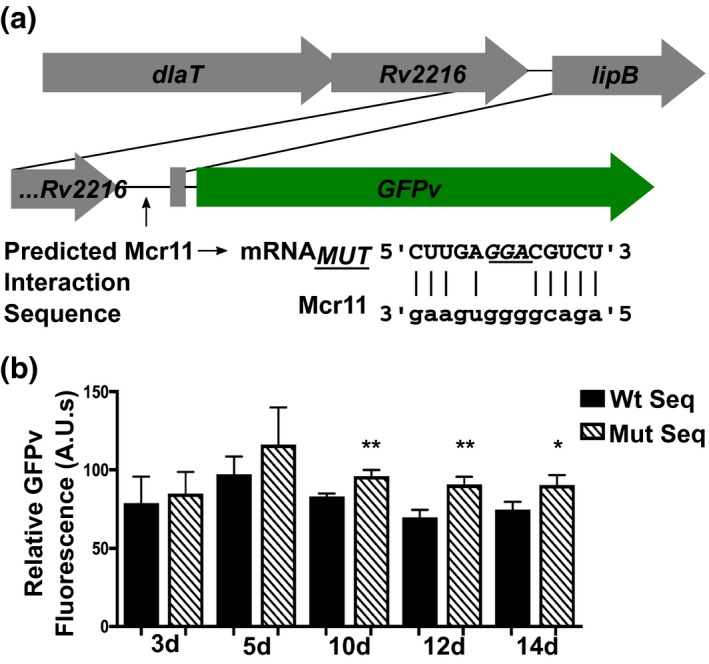
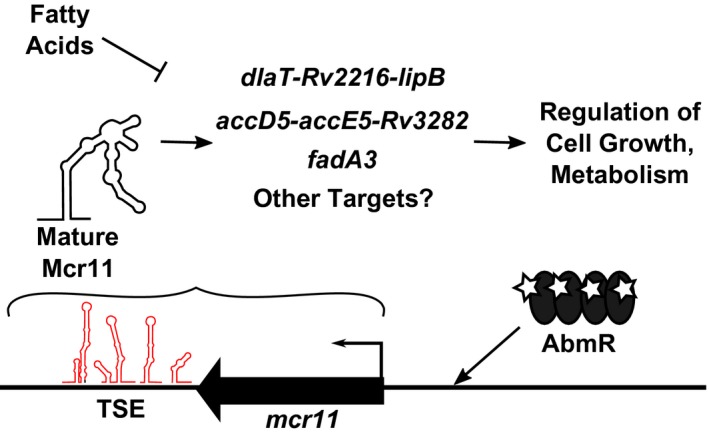
Mycobacterium tuberculosis (Mtb), the etiologic agent of tuberculosis, must adapt to host-associated environments during infection by modulating gene expression. Small regulatory RNAs (sRNAs) are key regulators of bacterial gene expression, but their roles in Mtb are not well understood. Here, we address the expression and function of the Mtb sRNA Mcr11, which is associated with slow bacterial growth and chronic infections in mice. We found that stable expression of Mcr11 requires multiple factors specific to TB-complex bacteria, including the AbmR transcription factor. Bioinformatic analyses used to predict regulatory targets of Mcr11 identified 7-11 nucleotide regions with potential for direct base-pairing with Mcr11 immediately upstream of Rv3282, fadA3, and lipB. mcr11-dependent regulation of these genes was demonstrated using qRT-PCR and found to be responsive to the presence of fatty acids. Mutation of the putative Mcr11 base-pairing site upstream of lipB in a promoter reporter strain resulted in significant de-repression of lipB expression, similar to that observed in mcr11-deleted Mtb. These studies establish Mcr11's roles in regulating growth and central metabolism in Mtb. Our finding that multiple TB-complex-specific factors are required for production of stable Mcr11 also emphasizes the need to better understand mechanisms of sRNA expression and stability in TB.

Keywords: RNA stability; RNA termination; gene regulation; lipoylation; sRNA targets.


Conflict of interest statement

None declared.

Figures

Figure 1
Figure 1
Secondary Structure modeling of 3′ sequences beyond the mapped 3′ end of Mcr11. (a) The DNA sequence of the mcr11 gene and extended 3′ sequence used for modeling experiments is shown. The mcr11 gene is shown in capital letters, and nucleotides where 5′ and 3′ boundaries have been mapped by RACE are indicated by arrows and shown in capitalized, bolded black text. Flanking sequences are in italics, and the Rv1264 stop codon in bolded red text. The last nucleotide on the 3′ side of mcr11 that was included in modeling experiments is in bold, lowercase black text. An asterisk indicates 3′ ends reported by DiChiara et al and DeJesus et al. Positions of mapped nucleotides on the Mtb chromosome are shown above the text. (b) Secondary structure diagrams of Mcr11 from 5′ position 1413227 and extended 3′ native sequences. The synthetic idealized intrinsic termination control (ttsbiB) is also modeled onto Mcr11 from the longest 3′ end reported at position 1413094; the last nucleotide of native sequence 3′ to Mcr11 is indicated by a black arrow. Black nucleotides indicate bases in the mapped boundaries of the mcr11 gene, red base pairs indicate base pairs beyond the mapped 3′ end of Mcr11 at position 1413107, except all uracils (Us) are shown in blue. An asterisk indicates that last nucleotide modeled in (c). (c). The secondary structure models with the lowest minimum free energies (MFE) of a shorter untested native Mcr11 TSE with the most U rich sequence at the 3′ end of the putative terminator. The MFE of each structure is shown below each diagram [Colour figure can be viewed at https://www.wileyonlinelibrary.com]
Figure 2
Figure 2
TSEs decrease transcriptional read‐through of Mcr11‐GFPv reporters, but Mcr11 is not robustly expressed in Msm, even in the presence of abmR from Mtb. (a). A schematic representation of GFPv fluorescence‐based reporter assay to determine the functionality of TSEs, and a synthetic idealized intrinsic termination control (ttsbiB). (b). GFPv fluorescence assay used to measure promoter activity and read‐through of TSEs of mcr11 in late stationary phase Msm, which lacks a native mcr11 locus. The promoter Ptuf served as a positive control. The various TSE constructs tested are indicated underneath the corresponding bar. Statistical comparisons are relative to Pmcr11. (c). The % termination of constructs tested in (b). Statistical comparisons are relative to TSE1. (d). Northern blot analysis of Mcr11 expression (M) in Msm with various mcr11 + TSE constructs. About 10 µg of total Msm RNA was loaded, whereas 3 µg of the BCG positive control was loaded. The HisT tRNA (H) was used as a loading control. The bar chart displays the normalized levels of Mcr11 as determined by densitometry. Statistical comparison is between TSE4 + abmR and TSEs 1–4 and ttsbiB. (e). GFPv fluorescence assay used to measure promoter activity in Msm. Statistical comparisons are relative to Pmcr11 or between 24 h and 28 h as indicated. Fluorescence is normalized to the OD620 of each sample. Results are the means of three biological replicates. Statistical analysis conducted with an unpaired, two‐tailed Student’s t‐test (e) or by one‐way ANOVA with Bonferroni correction for multiple comparisons (b, c, d). Asterisks indicate significance as follows: *p < .05, **p < .01, ***p < .001, ****p < .0001 [Colour figure can be viewed at https://www.wileyonlinelibrary.com]
Figure 3
Figure 3
Efficiency of TSEs is positively regulated in response to growth phase in BCG and function significantly better in Mtb. (a) GFPv fluorescence assay used to measure promoter activity and read‐through of the TSEs of mcr11 in mid‐log phase BCG in hypoxic (1.3% O2, 5% CO2), shaking conditions. A promoterless (−) construct was used as a negative control and the promoters Ptuf and Pgyr served as positive controls. The various TSE constructs tested are indicated underneath the corresponding bar. Statistical comparisons were made to Pmcr11. (b) As in (a), but assayed in late stationary phase. (c) A comparison of % termination observed in mid‐log phase (solid bars) and late stationary phase (hatched bars) BCG. Statistical comparisons were made between mid‐log and stationary phase. (d) GFPv fluorescence assay used to measure promoter activity and read‐through of the TSEs of mcr11 in mid‐log phase Mtb in hypoxic (1.3% O2, 5% CO2), shaking conditions. A promoterless (−) construct was used as a negative control and the promoters Ptuf and Pgyr serve as positive controls. The various TSE constructs tested are indicated underneath the corresponding bar. Statistical comparisons are made to Pmcr11. Fluorescence is normalized to the OD620 of each sample. (e) As in (d), but assayed in late stationary phase. Statistical comparisons are made to Pmcr11. (f) A comparison of % termination observed in late stationary phase Msm, BCG and Mtb. Statistical comparisons are made to Mtb. Results are the means of three biological replicates. Statistical analysis conducted with a one‐way ANOVA with Bonferroni correction for multiple comparisons. Asterisks indicate significance as follows: * p < .05, ** p < .01, *** p < .001, **** p < .0001
Figure 4
Figure 4
Different Mcr11 TSEs do not alter the size of stable Mcr11. Northern blot analysis of Mcr11 expression in (a) BCG or (b) H37Rv in hypoxic (1.3% O2, 5% CO2) late stationary phase. The tRNA HisT is used as a loading control. Results of densitometry analysis are presented below the corresponding blot. (c) qPCR analysis of Mcr11 expression in mid‐log and late stationary phase BCG, normalized to sigA expression. Results representative of 2–3 independent repeats
Figure 5
Figure 5
Δmcr11 has a disrupted abmR promoter, resulting in reduced expression of AbmR protein in BCG and Mtb. (a) The mcr11 locus with the position of the hygromycin knockout cassette is shown. The regions of DNA used to create promoter:lacZ fusions are shown. Fragment (1) includes the Rv1264‐abmR intergenic region, which includes the mcr11 locus. Fragment (2) includes the mcr11‐Rv1265 sequence that is available in the Δmcr11 strain. (b) Quantification of Western blot analysis from BCG grown to late‐log phase in ambient, shaking conditions. (c) Quantification of Western blot analysis from Mtb grown to late‐log phase in hypoxic (1.3% O2, 5% CO2), shaking conditions. AbmR was detected with poly‐clonal anti‐sera, and levels were normalized to GlcB levels, as detected by a monoclonal antibody. (d) β‐galactosidase activity assays using the promoter:lacZ fusions shown in (a) in Wt BCG (gray bars) and MTB (black bars) grown to late‐log phase in ambient, shaking conditions. Fluorescence is normalized to the OD620 of each sample. An asterisk *indicates p‐value < .05 using an unpaired Student’s t‐test. Results representative of 2–3 biological repeats
Figure 6
Figure 6
Bioinformatic modeling of Mcr11 targets reveals potential regulatory targets that are involved in central metabolism and cell division. (a) The organization of the dlaT‐lipB locus, with the position and potential base‐pairing interactions between the mRNA and Mcr11 is shown below. The transcriptional start site of the operon is shown with a thin black arrow. (b) As in (a), but for the accD5‐Rv3282 locus. Dashes indicate Watson–Crick base pairs, dots indicate non‐Watson–Crick base pairs, and a blank space indicates no interaction between bases. (c) As in (a) and (b), but for the Rv1074c/fadA3 locus. (d) The MFE secondary structure of Mcr11 as predicted by RNAStructure, with the portion of the sRNA predicted to interact with targets is shown in (a‐c) outlined in black
Figure 7
Figure 7
Δmcr11 strains of BCG and Mtb are defective for growth in fatty‐acid depleted media and predicted regulatory targets of Mcr11 are dysregulated at the mRNA level. (a) Mtb was grown for 12 days in under hypoxic (1.3% O2, 5% CO2), shaking conditions in −OA media (7H9 + 0.2% glycerol, 10% ADC and 0.05% Tween‐80). Gene expression was measured by qRT‐PCR and normalized to the reference gene sigA. Comparison made of each strain versus Δmcr11. Complementation strains included a single‐copy of mcr11 with TSE3 fused to GFPv or a single‐copy of the abmR locus and mcr11 with TSE4. (b) Mtb was grown for 7 days in under hypoxic, shaking conditions in + OA media (7H9 + 0.2% glycerol, 10% OADC and 0.05% Tween‐80). Gene expression was measured by qRT‐PCR and normalized to the reference gene sigA. (c) BCG was grown for 12 days in under hypoxic, shaking conditions in ‐OA media. Gene expression was measured by qRT‐PCR and normalized to the reference gene sigA. (d) BCG was grown for 12 days in under hypoxic, shaking conditions in + OA media. Gene expression was measured by qRT‐PCR and normalized to the reference gene sigA. (e) Growth curve of Mtb grown in hypoxic, shaking conditions in −OA media. Growth was surveyed by measuring the optical density at 620 nm (OD620). (f) Growth curve of Mtb grown in hypoxic, shaking conditions in + OA media. Growth was surveyed by measuring OD620. (g) As in (E), but with BCG. H. As in (F), but with BCG. Results are the means of three biological replicates. Statistical comparisons made of each strain versus Δmcr11 using a one‐way ANOVA with Bonferroni correction for multiple comparisons. Asterisks indicate significance as follows: *p < .05, **p < .01, ***p < .001, ****p < .0001 [Colour figure can be viewed at https://www.wileyonlinelibrary.com]
Figure 8
Figure 8
The bioinformatically predicted Mcr11 base‐pairing sequence is required for the repression of lipB expression in Mtb. (a) The organization of the dlaT‐lipB locus, with the internal promoter:GFPv fusion reporter construct and the disrupted potential base‐pairing interactions between the lipB mRNA and Mcr11 is shown below. The bases in the lipB promoter that were mutagenized are indicated in underlined italics. (b) Mtb was grown for 14 days in under hypoxic (1.3% O2, 5% CO2), shaking conditions in −OA media (7H9 + 0.2% glycerol, 10% ADC and 0.05% Tyloxapol). Expression from the lipB internal promoter was measured using a GFPv fluorescence assay used to measure promoter activity at the indicated time points. Fluorescence is normalized to the OD620 of each sample. Expression from the lipB promoter with wild‐type sequence is shown in black bars and expression from the mutagenized promoter is shown in slashed bars. Results are the means of three biological replicates. Statistical analysis conducted with a two‐tailed Student’s T‐test to compare the expression of the lipB promoter with wild‐type sequence to the mutagenized promoter at each time point. Asterisks indicate significance as follows: *p < .05, **p < .01, ***p < .001, ****p < .0001 [Colour figure can be viewed at https://www.wileyonlinelibrary.com]
Figure 9
Figure 9
Model of Mcr11 function in Mtb. Expression of mcr11 is activated by advancing growth phase and the ATP‐binding transcription factor AbmR. Native 3′ sequence elements (TSEs, predicted secondary structures shown in red) promote the transcriptional termination of Mcr11 (shown in black). Mcr11 regulates the expression of genes involved in the central metabolism and growth of Mtb through base‐pairing interaction between Mcr11 and target mRNAs. This regulation and the importance of Mcr11 for optimal growth of Mtb is affected by the presence of fatty acids [Colour figure can be viewed at https://www.wileyonlinelibrary.com]

References

    1. Abendroth, J. , Ollodart, A. , Andrews, E. S. , Myler, P. J. , Staker, B. L. , Edwards, T. E. , … Grundner, C. (2014). Mycobacterium tuberculosis Rv2179c protein establishes a new exoribonuclease family with broad phylogenetic distribution. Journal of Biological Chemistry, 289, 2139–2147. - PMC - PubMed
    1. Arnvig, K. B. , Comas, I. , Thomson, N. R. , Houghton, J. , Boshoff, H. I. , Croucher, N. J. , … Young, D. B. (2011). Sequence‐based analysis uncovers an abundance of non‐coding RNA in the total transcriptome of Mycobacterium tuberculosis . PLoS Path, 7, e1002342 10.1371/journal.ppat.1002342 - DOI - PMC - PubMed
    1. Arnvig, K. B. , & Young, D. B. (2009). Identification of small RNAs in Mycobacterium tuberculosis . Molecular Microbiology, 73, 397–408. - PMC - PubMed
    1. Bardarov, S. , Bardarov, S., Jr. , Pavelka, M. S., Jr., Sambandamurthy, V. , Larsen, M. , Tufariello, J. , … Jacobs, W. R., Jr. (2002). Specialized transduction: An efficient method for generating marked and unmarked targeted gene disruptions in Mycobacterium tuberculosis, M. bovis BCG and M. smegmatis. Microbiology, 148, 3007–3017. 10.1099/00221287-148-10-3007 - DOI - PubMed
    1. Bazet Lyonnet, B. , Diacovich, L. , Cabruja, M. , Bardou, F. , Quemard, A. , Gago, G. , & Gramajo, H. (2014). Pleiotropic effect of AccD5 and AccE5 depletion in acyl‐coenzyme A carboxylase activity and in lipid biosynthesis in mycobacteria. PLoS ONE, 9, e99853 10.1371/journal.pone.0099853 - DOI - PMC - PubMed

Publication types

MeSH terms

LinkOut - more resources