

Influence of fitting approaches in LCModel on MRS quantification focusing on age-specific macromolecules and the spline baseline
- PMID: 31782845
- PMCID: PMC7255930
- DOI: 10.1002/nbm.4197
Influence of fitting approaches in LCModel on MRS quantification focusing on age-specific macromolecules and the spline baseline
Abstract
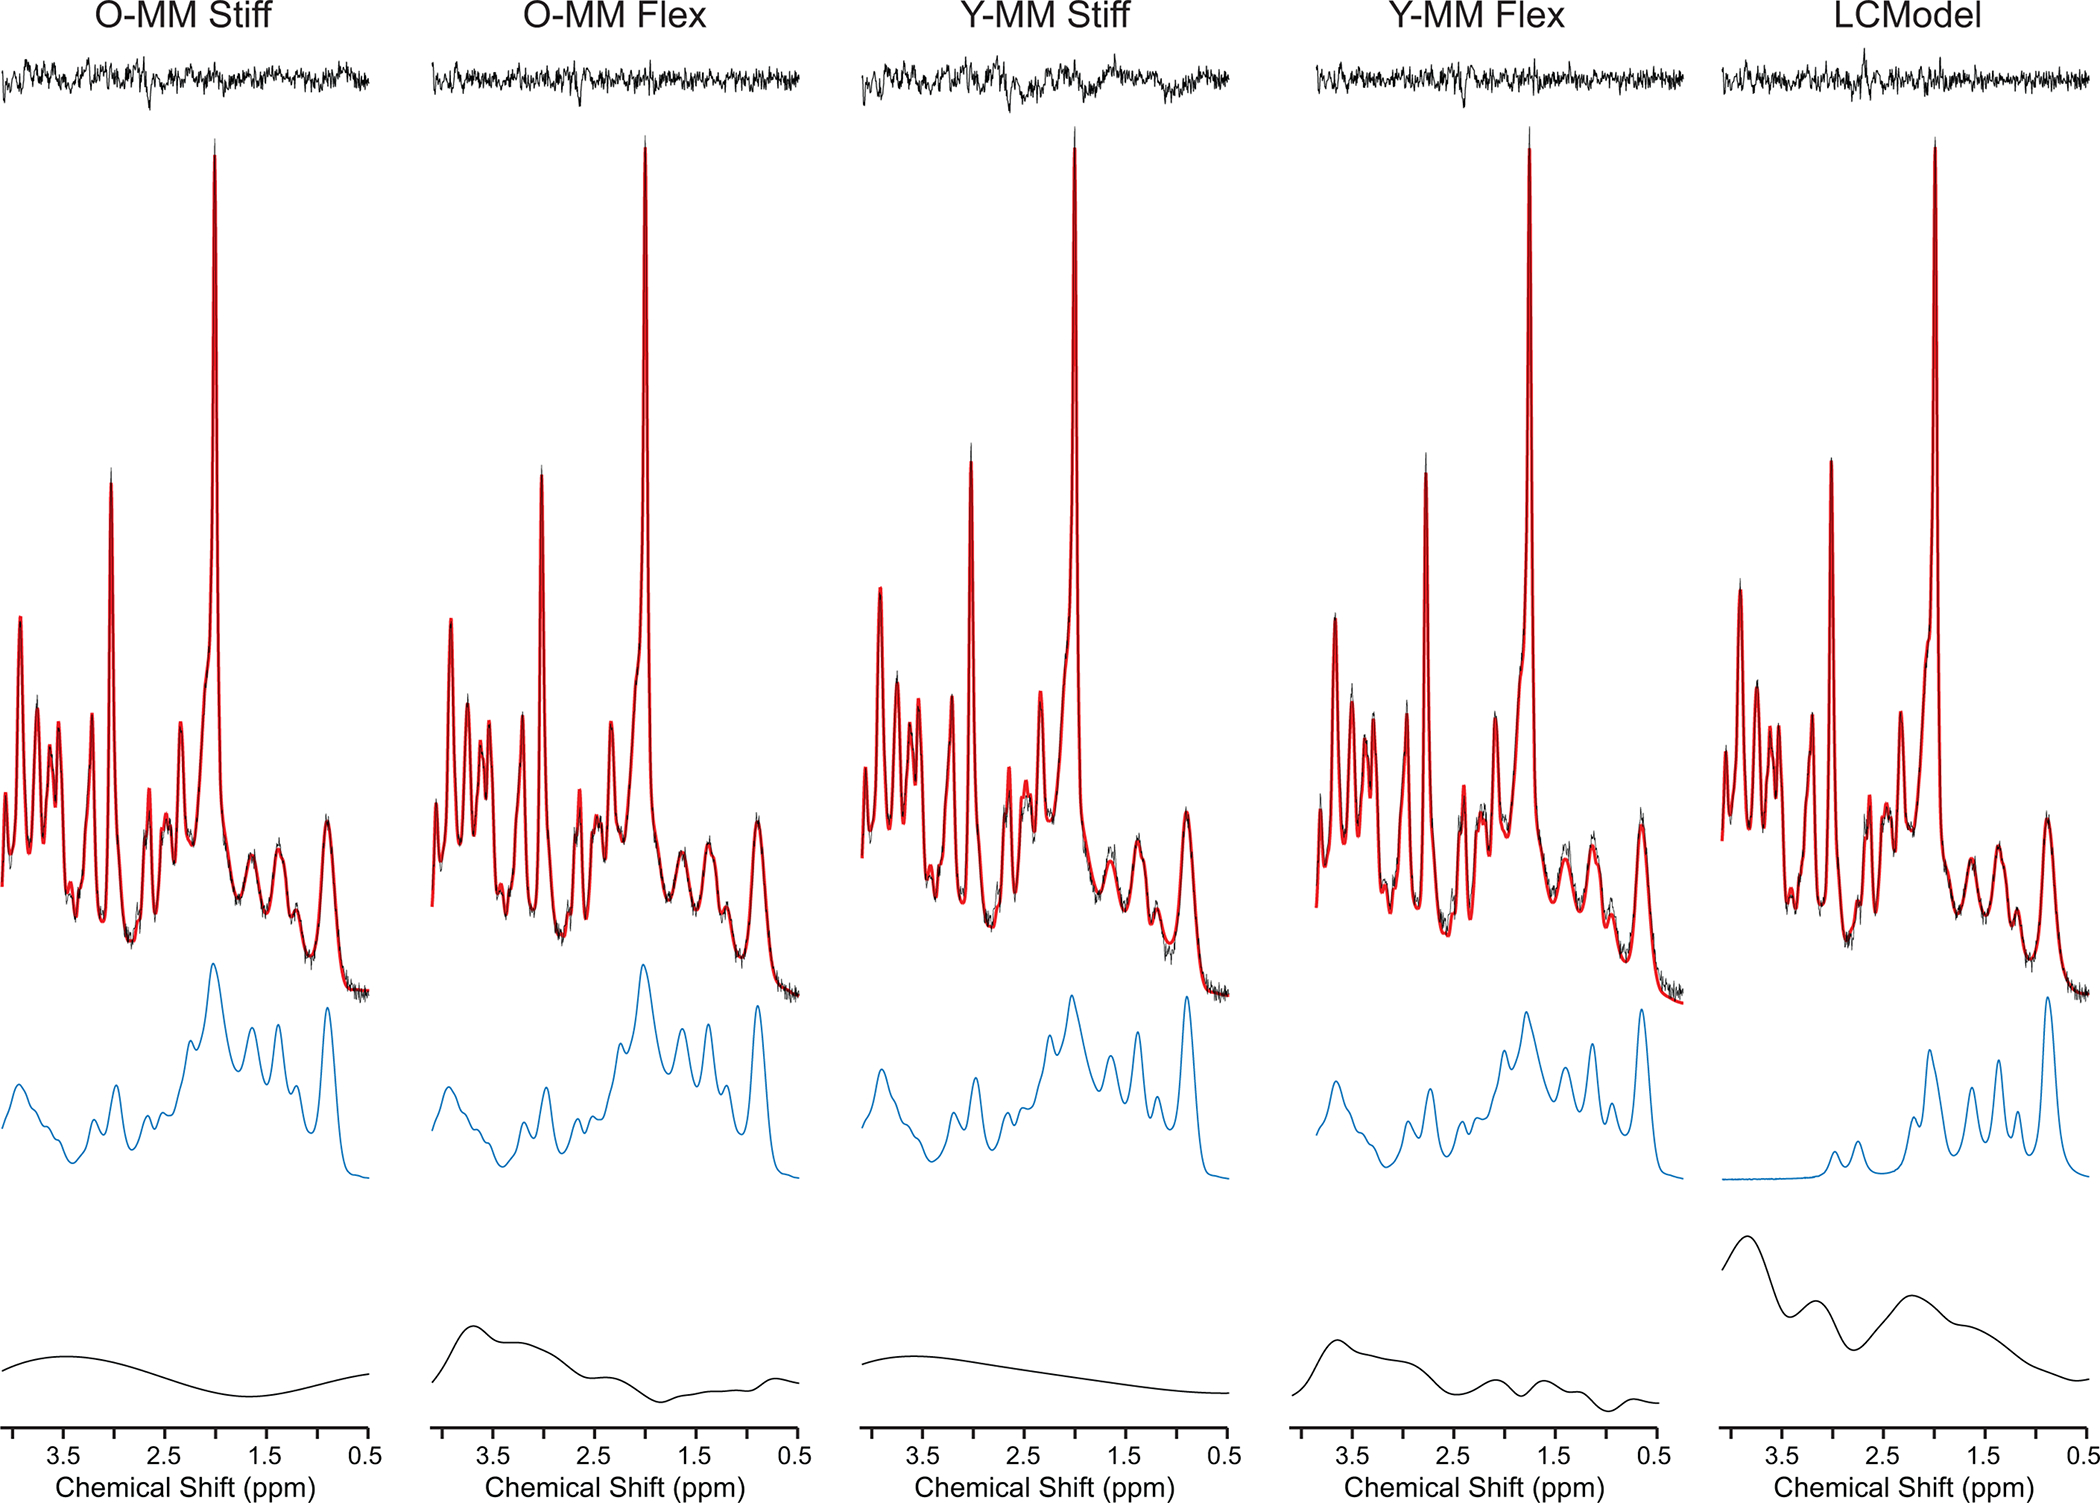
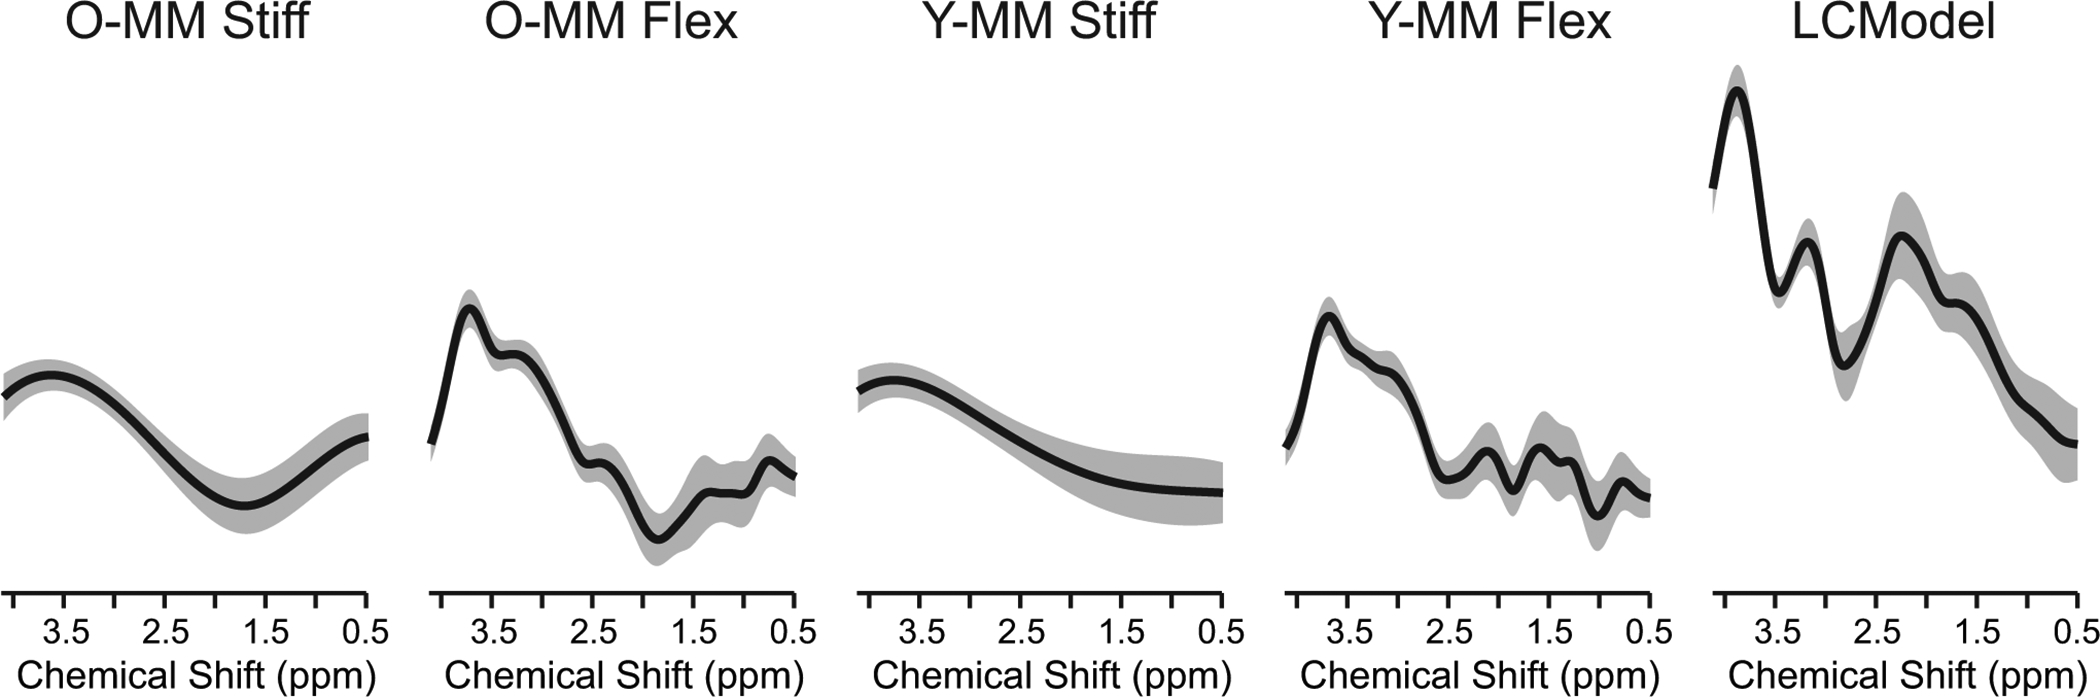
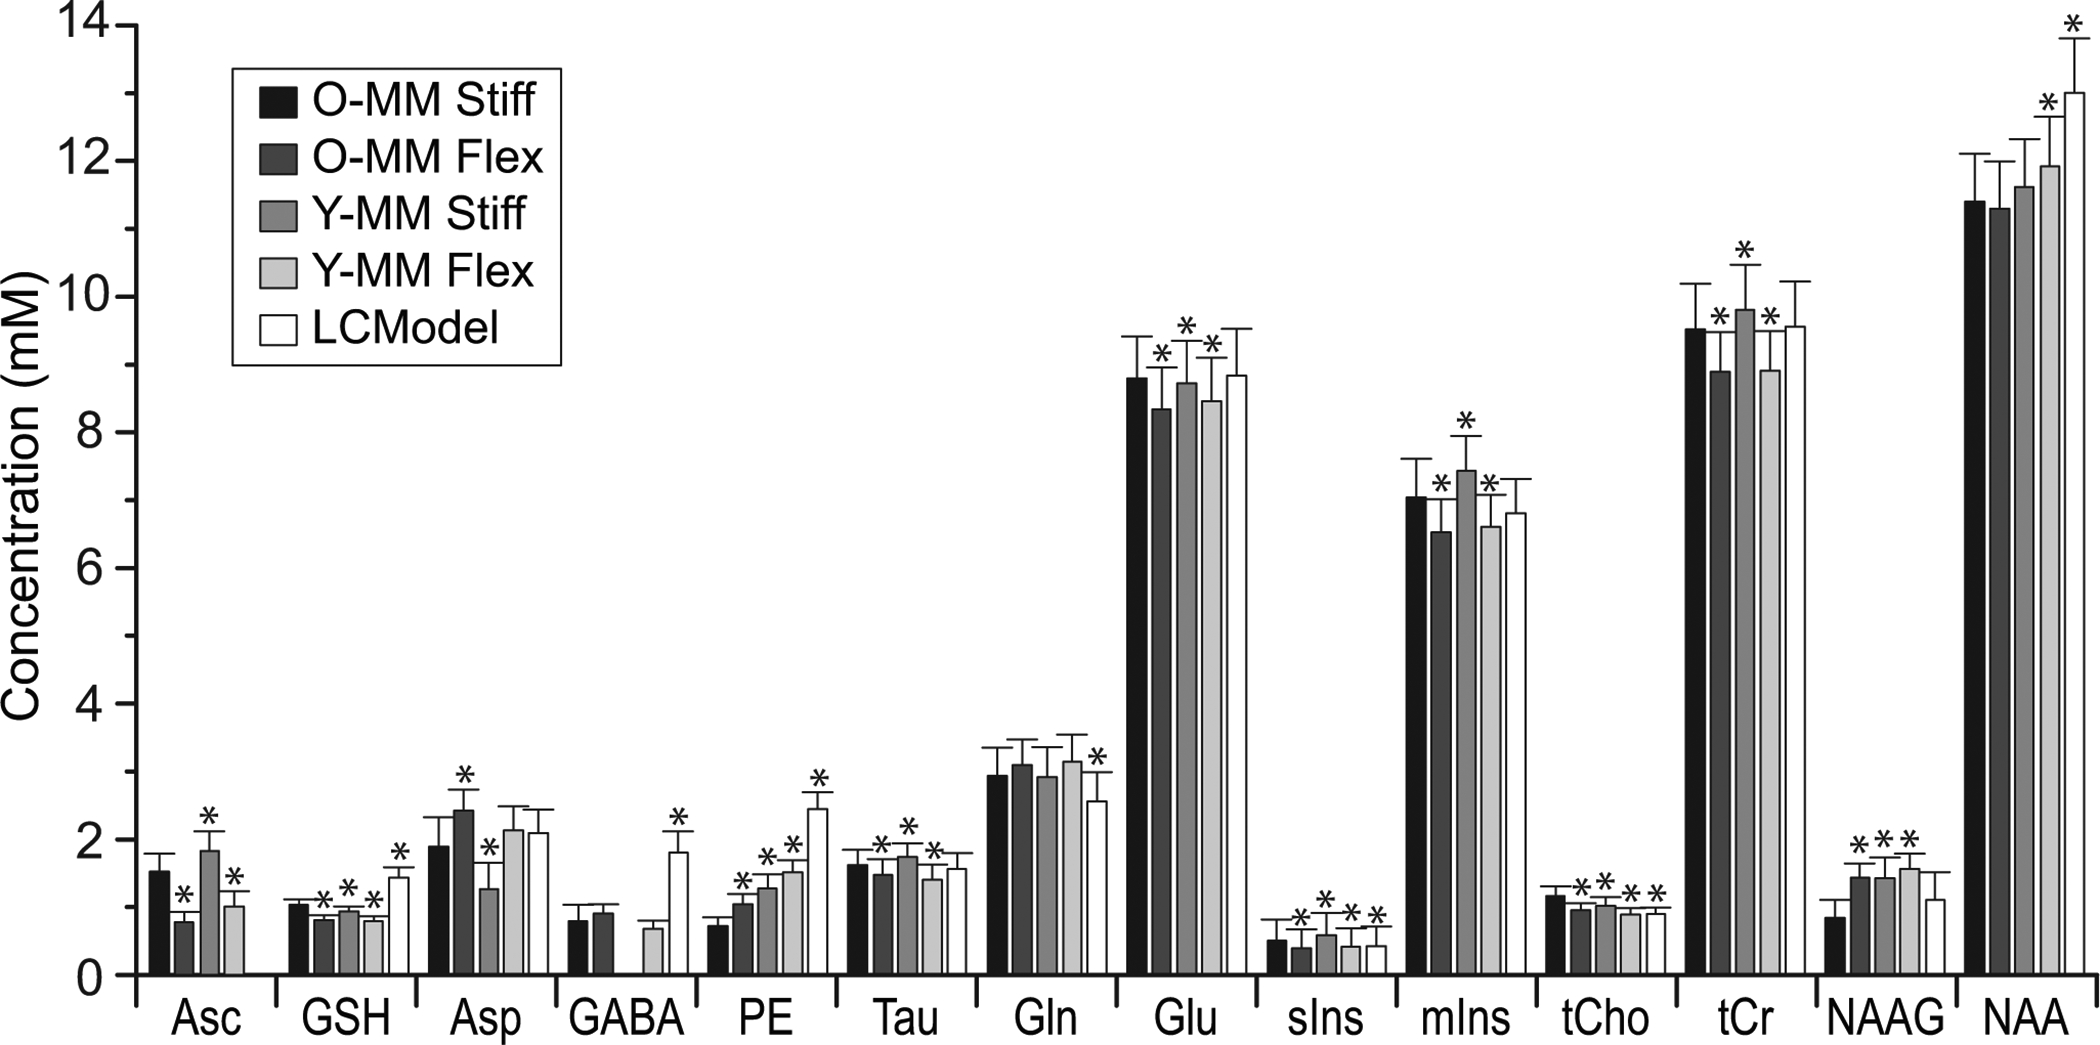
Quantification of neurochemical concentrations from 1 H MR spectra is challenged by incomplete knowledge of contributing signals. Some experimental conditions hinder the acquisition of artifact-free spectra and impede the acquisition of condition-specific macromolecule (MM) spectra. This work studies differences caused by fitting solutions routinely employed to manage resonances from MM and lipids. High quality spectra (free of residual water and lipid artifacts and for which condition-specific MM spectra are available) are used to understand the influences of spline baseline flexibility and noncondition-specific MM on neurochemical quantification. Fitting with moderate spline flexibility or using noncondition-specific MM led to quantification that differed from when an appropriate, fully specified model was used. This occurred for all neurochemicals to an extent that varied in magnitude among and within approaches. The spline baseline was more tortuous when less constrained and when used in combination with noncondition-specific MM. Increasing baseline flexibility did not reproduce concentrations quantified under appropriate conditions when spectra were fitted using a MM spectrum measured from a mismatched cohort. Using the noncondition-specific MM spectrum led to quantification differences that were comparable in size with using a fitting model that had moderate freedom, and these influences were additive. Although goodness of fit was better with greater fitting flexibility, quantification differed from when fitting with a fully specified model that is appropriate for low noise data. Notable GABA and PE concentration differences occurred with lower estimates of measurement error when fitting with greater spline flexibility or noncondition-specific MM. These data support the need for improved metrics of goodness of fit. Attempting to correct for artifacts or absence of a condition-specific MM spectrum via increased spline flexibility and usage of noncondition-specific MM spectra cannot replace artifact-free data quantified with a condition-specific MM spectrum.
Keywords: 7 T; LCModel; macromolecules; magnetic resonance spectroscopy; ultrahigh field.
© 2019 John Wiley & Sons, Ltd.
Figures
References
-
- Behar KL, Rothman DL, Spencer DD, Petroff OA. Analysis of macromolecule resonances in 1H NMR spectra of human brain. Magn Reson Med. September 1994;32(3):294–302. - PubMed
-
- Schaller B, Xin L, Gruetter R. Is the macromolecule signal tissue-specific in healthy human brain? A 1H MRS study at 7 Tesla in the occipital lobe. Magn Reson Med. October 2014;72(4):934–940. - PubMed
-
- Provencher SW. Estimation of metabolite concentrations from localized in vivo proton NMR spectra. Magn Reson Med. December 1993;30(6):672–679. - PubMed
-
- Provencher SW. Automatic quantitation of localized in vivo 1H spectra with LCModel. NMR Biomed. June 2001;14(4):260–264. - PubMed
Publication types
MeSH terms
Substances
Grants and funding
LinkOut - more resources
Full Text Sources
Medical
