. 2020 Feb;14(2):329-346.
doi: 10.1002/1878-0261.12607. Epub 2019 Dec 13.

UHRF1 downmodulation enhances antitumor effects of histone deacetylase inhibitors in retinoblastoma by augmenting oxidative stress-mediated apoptosis

Affiliations

UHRF1 downmodulation enhances antitumor effects of histone deacetylase inhibitors in retinoblastoma by augmenting oxidative stress-mediated apoptosis

Jong Kyong Kim et al. Mol Oncol. 2020 Feb.

Abstract

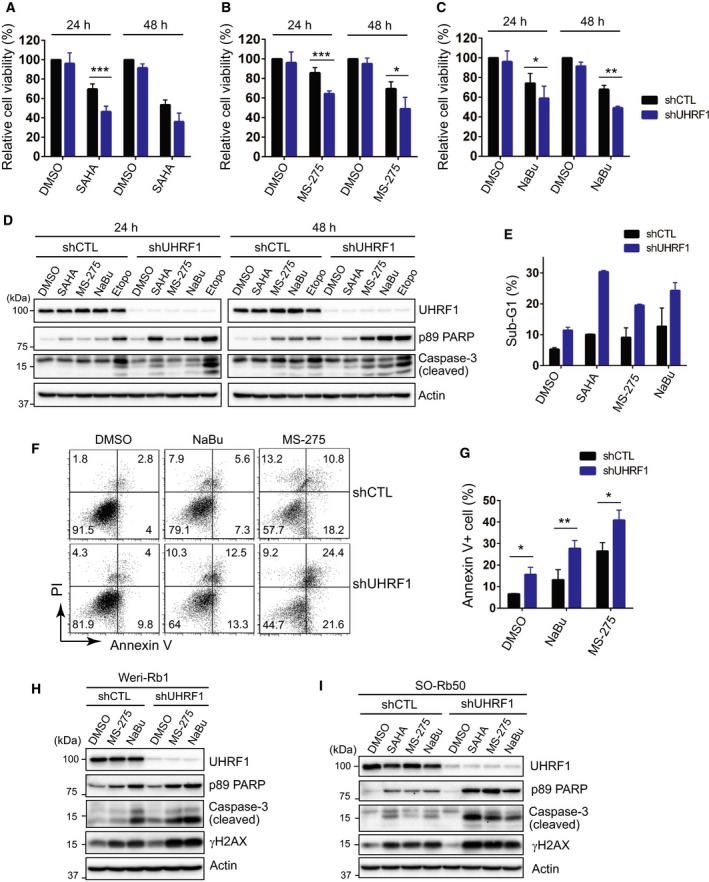
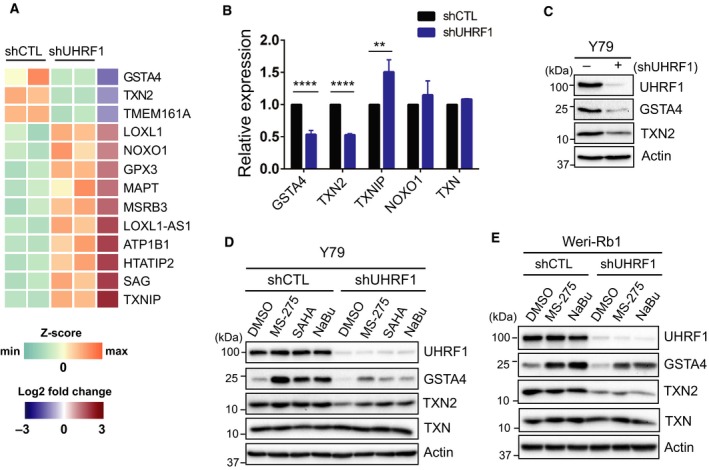
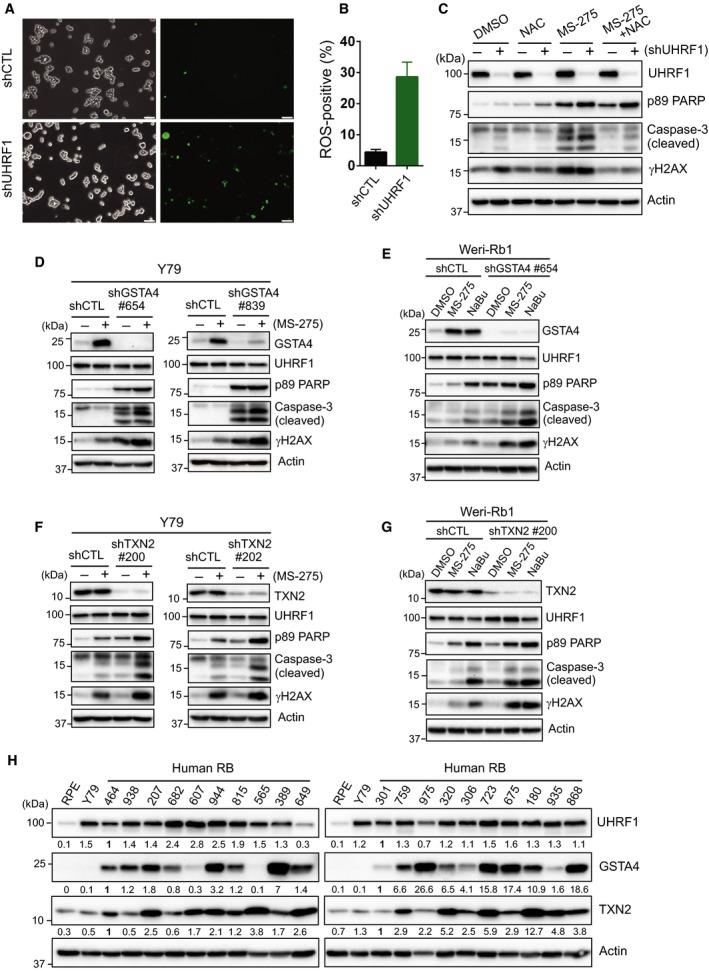
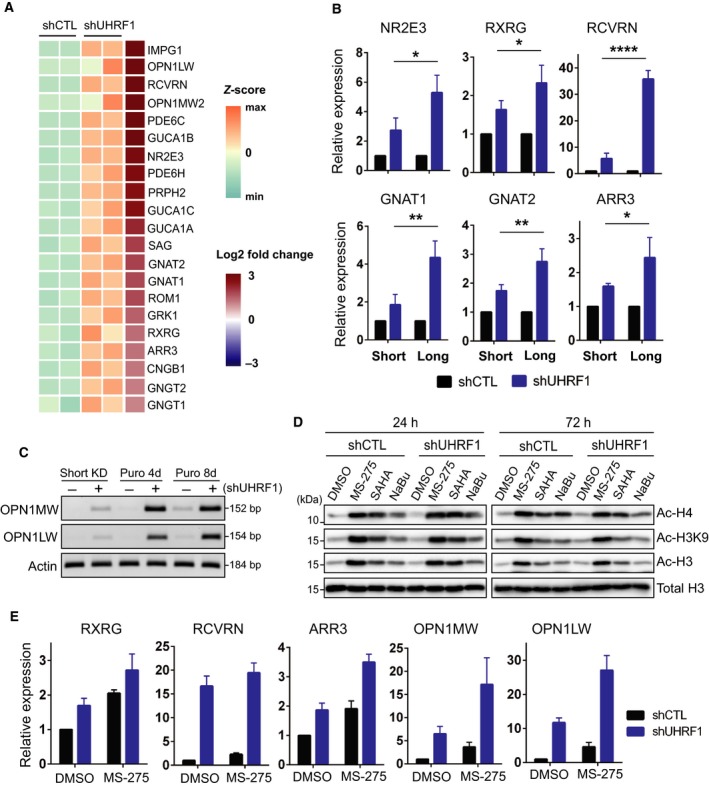
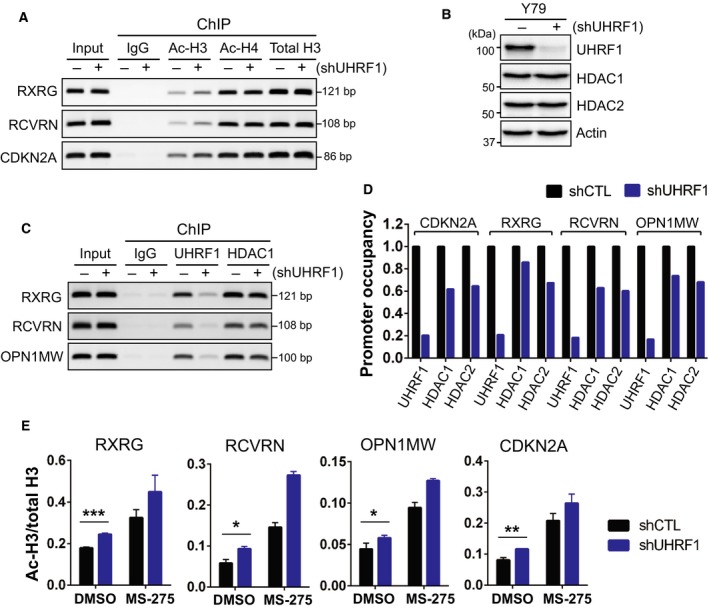
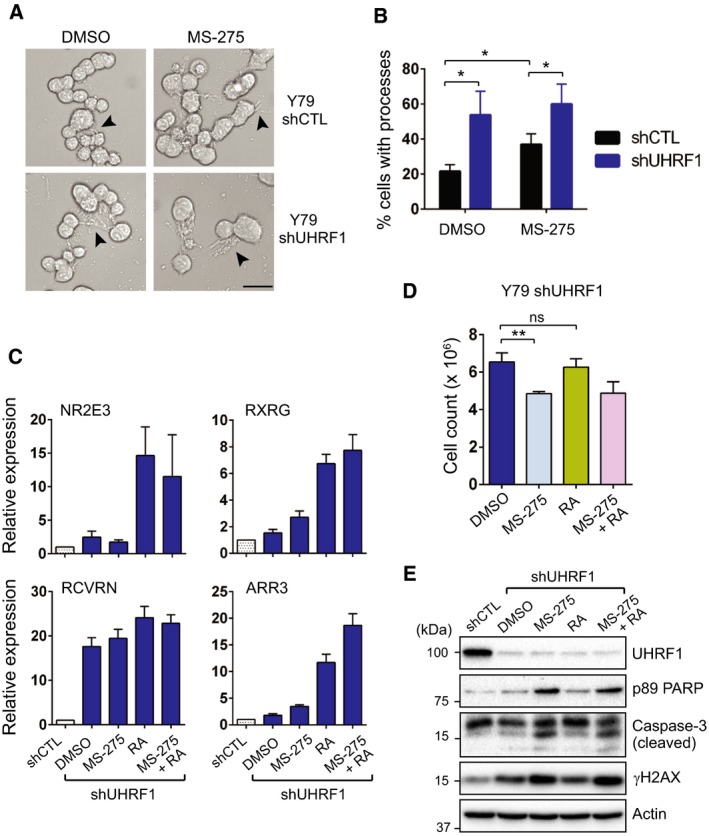
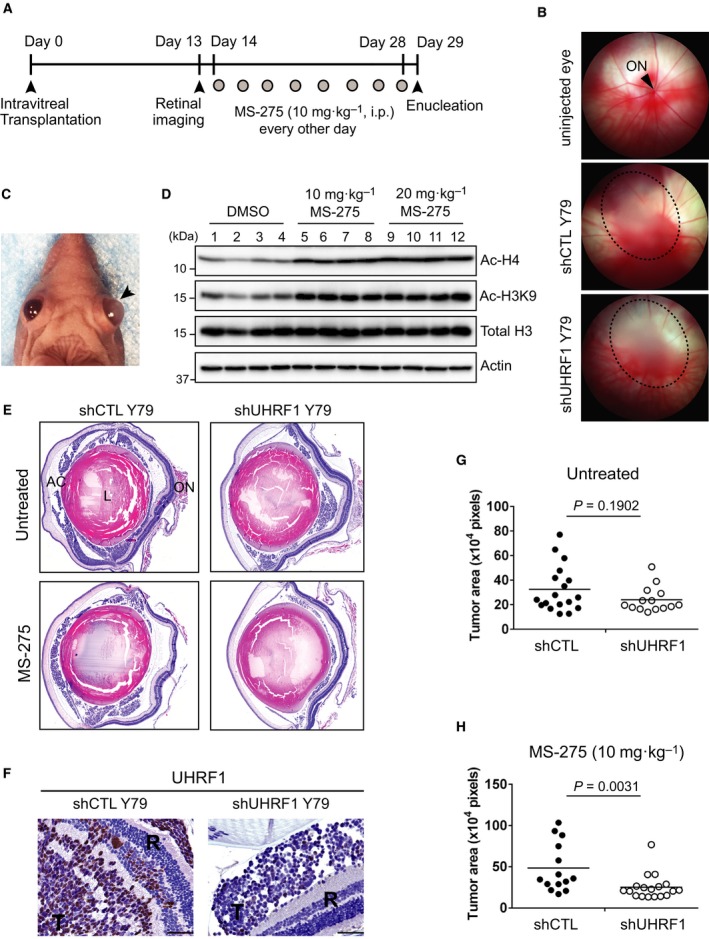
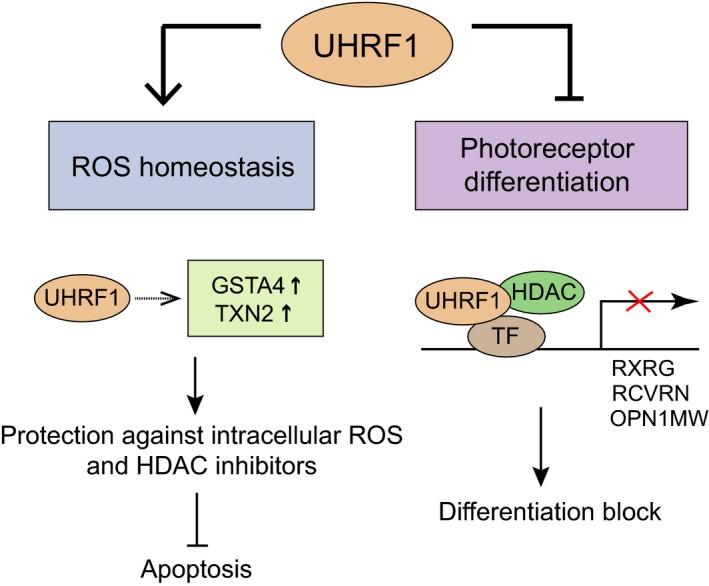
Identification of new genetic pathways or molecular targets that sensitize cancer cells to chemotherapeutic drugs may improve the efficacy of current chemotherapy. Here, we report that downmodulation of UHRF1 (ubiquitin-like with PHD and RING finger domains 1) in retinoblastoma (RB) cells increases the sensitivity to histone deacetylase (HDAC) inhibitors, augmenting apoptotic cell death. We found that UHRF1 depletion downregulates two redox-responsive genes GSTA4 (glutathione S-transferase α4) and TXN2 (thioredoxin-2) in RB cells, and increases the basal level of intracellular oxidative stress. Antioxidant treatment significantly reduced both basal and HDAC inhibitor-induced DNA damage and apoptosis in UHRF1-depleted cells. Knockdown of GSTA4 or TXN2 sensitized RB cells to HDAC inhibitors, demonstrating that GSTA4 and TXN2 play key roles in redox homeostasis in RB cells and the susceptibility to HDAC inhibitor treatment upon UHRF1 depletion. In human primary RB, GSTA4 and TXN2 proteins were found to be mostly elevated along with high UHRF1 expression. In addition to augmentation of apoptosis in UHRF1-depleted RB cells, we also show that UHRF1 downmodulation derepresses the expression of photoreceptor-specific genes in RB cells in cooperation with a HDAC inhibitor MS-275 and promotes neuron-like differentiation. However, further investigation revealed that the enhanced growth-inhibitory effects of MS-275 in UHRF1-depleted cells were still mainly due to robust apoptosis induction rather than differentiation-mediated growth arrest. Consistent with our findings, UHRF1 depletion in RB cells increased the therapeutic efficacy of MS-275 in murine orthotopic xenografts. These results provide a novel basis for potential benefits of UHRF1 targeting for RB treatment.

Keywords: HDAC inhibitors; UHRF1; chemotherapy; drug sensitivity; retinoblastoma.


Conflict of interest statement

The authors declare no conflict of interest.

Figures

Figure 1
Figure 1
UHRF1 depletion sensitizes RB cells to HDAC inhibitors. (A–C) Relative cell viability determined by live cell counting after treatment with HDAC inhibitors. Stable control‐knockdown (shCTL) and UHRF1‐knockdown (shUHRF1) Y79 cells were treated with 1 µm SAHA (A), 1 µm MS‐275 (B), and 1 mm NaBu (C) for the indicated time. The results are shown as the mean ± standard deviation (SD) of % fold changes from three independent experiments, relative to the cell viability in shCTL cells treated with vehicle (DMSO). *P < 0.05, **P < 0.01, ***P < 0.001: unpaired Student's t‐test (two‐tailed). (D) Immunoblots for indicated proteins in Y79 shCTL and shUHRF1 cells after exposure to 1 µm SAHA, 1 µm MS‐275, and 1 mm NaBu for the indicated time. Cells treated with 10 µm etoposide (Etopo) for 24 h are shown as common positive controls for apoptosis in parallel. (E) Percentages of sub‐G1 population determined by flow cytometry in shCTL and shUHRF1 Y79 cells treated with HDAC inhibitors as in (D) for 24 h. The results are shown as the mean ± SD from triplicate experiments. (F) Annexin V+ apoptotic cell populations detected by flow cytometry after treatment with 1 mm NaBu or 1 µm MS‐275 for 48 h. The percentage of population in each quadrant is shown. (G) Percentages of annexin V+ cells determined in (F). The results are shown as the mean ± SD from three independent experiments. *P < 0.05, **P < 0.01: unpaired Student's t‐test (two‐tailed). (H) Immunoblots in Weri‐Rb1 shCTL and shUHRF1 cells treated with 1 µm MS‐275 or 1 mm NaBu for 20 h. (I) Immunoblots in SO‐Rb50 shCTL and shUHRF1 cells after exposure to 1 µm SAHA, 1 µm MS‐275, and 1 mm NaBu for 28 h.
Figure 2
Figure 2
UHRF1 depletion deregulates redox‐responsive genes in RB cells. (A) Heat map of differentially expressed genes related to redox and oxidative stress in shUHRF1 Y79 cells. Each column represents an independent replicate. (B) qRT‐PCR analysis for the relative expression of indicated genes in Y79 shCTL and shUHRF1 cells. The bar graph is shown as the mean ± SD of fold changes from four independent experiments, relative to the normalized level in shCTL cells. **P < 0.01, ****P < 0.0001: unpaired Student's t‐test (two‐tailed). (C) Basal expression changes in GSTA4 and TXN2 upon UHRF1 knockdown in Y79 cells. (D) Immunoblots for indicated proteins in Y79 shCTL and shUHRF1 cells after exposure to 1 µm MS‐275, 1 µm SAHA, and 1 mm NaBu for 24 h. (E) Immunoblots in Weri‐Rb1 shCTL and shUHRF1 cells treated with 1 µm MS‐275 or 1 mm NaBu for 20 h.
Figure 3
Figure 3
Downregulation of GSTA4 and TXN2 by UHRF1 depletion contributes to enhanced sensitivity to HDAC inhibitors in RB cells. (A) Detection of basal intracellular ROS levels by reactivity with a fluorescent probe in Y79 shCTL and shUHRF1 cells. ROS (green fluorescence)‐positive cells are shown along with phase contrast images of the cells on the left. Scale bars: 50 µm. (B) Quantification of ROS‐positive cells shown in (A). Over 900 total cells from five randomly selected fields were evaluated for ROS positivity. The data represent the mean ± SD from two replicates. (C) Immunoblots for indicated proteins in Y79 control (−) and UHRF1‐knockdown (+) cells subjected to a single or combined treatment with 10 mm NAC and 1 µm MS‐275 for 48 h. (D) Immunoblots in Y79 shGSTA4 (clones #654 and #839) cells treated with 1 µm MS‐275 for 24 h. (E) Immunoblots in Weri‐Rb1 shGSTA4 cells treated with 1 µm MS‐275 or 1 mm NaBu for 20 h. (F) Immunoblots in Y79 shTXN2 (clones #200 and #202) cells treated with 1 µm MS‐275 for 48 h. (G) Immunoblots in Weri‐Rb1 shTXN2 cells treated as in (E). (H) Expression of GSTA4 and TXN2 in human RB tumor lysates. Relative abundance of proteins determined by densitometry is shown below each panel of the blots, in comparison with the first human RB sample on each panel. RPE: retinal pigment epithelium.
Figure 4
Figure 4
UHRF1 depletion derepresses expression of photoreceptor genes in RB cells. (A) Heat map of differentially expressed genes related to photoreceptor and phototransduction in shUHRF1 Y79 cells. (B) Relative expression of photoreceptor genes in control and UHRF1‐knockdown Y79 cells subjected to short‐term knockdown (Short; 4 days post‐lentiviral infection without selection on puromycin) or long‐term knockdown (Long; 8 days' selection on puromycin in addition to the initial 4 days postinfection). The qRT‐PCR data are shown as the mean ± SD of fold changes from four independent experiments, relative to the normalized level in each control‐knockdown group. *P < 0.05, **P < 0.01, ****P < 0.0001: unpaired Student's t‐test (two‐tailed). (C) RT‐PCR analysis for indicated genes in control and UHRF1‐knockdown Y79 cells along the progression of selection on puromycin (puro) from short‐term knockdown (KD). (D) Immunoblots for indicated histones in Y79 shCTL and shUHRF1 cells after exposure to 0.5 µm MS‐275, 1 µm SAHA, and 1 mm NaBu for the indicated time. (E) Relative expression of photoreceptor genes in shCTL and shUHRF1 Y79 cells (puro 8d) treated with 0.5 µm MS‐275 for 48 h. The qRT‐PCR data are shown as the mean ± SD of fold changes from three independent experiments, relative to the normalized level in DMSO‐treated shCTL cells.
Figure 5
Figure 5
Increased histone H3 acetylation at photoreceptor gene promoters in UHRF1‐depleted RB cells. (A) ChIP‐PCR analysis for histone acetylation at indicated gene promoters in control (−) and UHRF1‐knockdown (+) Y79 cells. Promoter association of acetylated histone H3 (Ac‐H3) and H4 (Ac‐H4) is shown along with that of total histone H3. CDKN2A is a known UHRF1 target shown as a positive control for the analysis. (B) Immunoblots for indicated proteins in Y79 shCTL and shUHRF1 cells. (C) ChIP‐PCR analysis for UHRF1 and HDAC1 association at indicated gene promoters in shCTL and shUHRF1 Y79 cells. (D) Relative promoter occupancy of UHRF1 and HDACs at the indicated gene promoters determined by ChIP‐qPCR. The promoter association of each protein in shUHRF1 cells is shown, relative to that of shCTL cells. (E) ChIP‐qPCR analysis for histone H3 acetylation at indicated gene promoters in control and shUHRF1 Y79 cells treated with 0.5 µm MS‐275 for 2 days. The data are shown as the mean ± SD of normalized ratios of Ac‐H3/total H3 from three independent experiments. *P < 0.05, **P < 0.01, ***P < 0.001: unpaired Student's t‐test (two‐tailed).
Figure 6
Figure 6
The growth‐inhibitory effects of MS‐275 in UHRF1‐depleted cells are mainly through inducing apoptosis. (A) Phase contrast images of control and UHRF1‐knockdown Y79 cells after culturing in serum‐free neurobasal differentiation medium with or without 1 µm MS‐275 for 24 h. Arrowheads mark the neurite‐like processes extended from the cells. Scale bar: 25 µm. (B) Quantification of the cells with processes. Over 600 total cells per group were examined for the morphological changes. The graph is shown as the mean ± SD from three independent experiments. *P < 0.05: unpaired Student's t‐test (two‐tailed). (C) Relative expression of photoreceptor genes in shUHRF1 Y79 cells subjected to a single or combined treatment with 0.5 µm MS‐275 and 1 µm RA for 48 h. The qRT‐PCR data are shown as the mean ± SD of fold changes from three independent experiments, relative to the normalized level in DMSO‐treated shCTL cells. (D) Live cell counts from the treatment groups of shUHRF1 cells shown in (C). **P < 0.01, ns: not significant; unpaired Student's t‐test (two‐tailed). (E) Immunoblots for indicated proteins in shUHRF1 Y79 cells treated with either a single agent or both agents as in (C), in comparison with DMSO‐treated shCTL Y79 cells.
Figure 7
Figure 7
UHRF1 depletion enhances therapeutic effects of HDAC inhibitor in orthotopic xenografts of RB. (A) Schematic of orthotopic xenograft study. (B) Retinal imaging to monitor tumor development on day 13 post‐transplantation of shCTL and shUHRF1 Y79 cells. Xenografted eyes develop white cloud‐like tumors circled by dotted lines, whereas uninjected eyes show a clear retinal view. ON, optic nerve. (C) RB development in shCTL‐xenografted eye indicated by an arrowhead, in contrast to uninjected left eye. (D) Immunoblots for indicated proteins in retinal tissue lysates from the mice treated with either vehicle or two different doses of MS‐275 by intraperitoneal injection every other day for 2 weeks (four mice per group). (E) Representative images of tumor‐burdened eyes from each indicated group after H&E staining. AC, anterior chamber, L, lens, ON, optic nerve. (F) Immunostaining for UHRF1 on the indicated xenograft tumor sections. T: tumor, R: retina, scale bars: 50 µm. (G, H) Plots of average tumor area quantification in shCTL and shUHRF1 Y79 xenografts without treatments (G) or with MS‐275 treatments (H). Data points on the plots represent the average tumor area per section per mouse (n = 14–18 mice per group), and the horizontal bar of the dot plots indicates the mean value. The statistical analysis was performed by Mann–Whitney test (two‐tailed).
Figure 8
Figure 8
Proposed functions of UHRF1 in RB cells identified in this study. UHRF1 regulates ROS‐responsive genes to counteract the accumulation of intracellular ROS that RB cells may encounter due to their high metabolic activities for robust proliferation. This new function of UHRF1 may also contribute to protection against ROS‐generating drugs such as HDAC inhibitors to evade apoptotic cell death. On the other hand, UHRF1 participates in repression of photoreceptor differentiation as a corepressor in a multiprotein complex containing HDAC and presumably transcription factor (TF) to repress the photoreceptor‐specific genes.

Similar articles

Cited by

References

    1. Benavente CA, Finkelstein D, Johnson DA, Marine JC, Ashery‐Padan R and Dyer MA (2014) Chromatin remodelers HELLS and UHRF1 mediate the epigenetic deregulation of genes that drive retinoblastoma tumor progression. Oncotarget 5, 9594–9608. - PMC - PubMed
    1. Bots M, Verbrugge I, Martin BP, Salmon JM, Ghisi M, Baker A, Stanley K, Shortt J, Ossenkoppele GJ, Zuber J et al (2014) Differentiation therapy for the treatment of t(8;21) acute myeloid leukemia using histone deacetylase inhibitors. Blood 123, 1341–1352. - PMC - PubMed
    1. Bronner C, Krifa M and Mousli M (2013) Increasing role of UHRF1 in the reading and inheritance of the epigenetic code as well as in tumorogenesis. Biochem Pharmacol 86, 1643–1649. - PubMed
    1. Ceccacci E and Minucci S (2016) Inhibition of histone deacetylases in cancer therapy: lessons from leukaemia. Br J Cancer 114, 605–611. - PMC - PubMed
    1. Chan HS, Gallie BL, Munier FL and Beck Popovic M (2005) Chemotherapy for retinoblastoma. Ophthalmol Clin North Am 18, 55–63, viii. - PubMed

Publication types

MeSH terms