. 2020 Mar 4;26(4):557-569.
doi: 10.1093/ibd/izz284.

The Combination of Patient Profiling and Preclinical Studies in a Mouse Model Based on NOD/Scid IL2Rγ null Mice Reconstituted With Peripheral Blood Mononuclear Cells From Patients With Ulcerative Colitis May Lead to Stratification of Patients for Treatment With Adalimumab

Affiliations

The Combination of Patient Profiling and Preclinical Studies in a Mouse Model Based on NOD/Scid IL2Rγ null Mice Reconstituted With Peripheral Blood Mononuclear Cells From Patients With Ulcerative Colitis May Lead to Stratification of Patients for Treatment With Adalimumab

Henrika Jodeleit et al. Inflamm Bowel Dis. .

Abstract

Background: To date, responsiveness to tumor necrosis factor alpha inhibitors in ulcerative colitis (UC) patients is not predictable. This is partially due to a lack of understanding of the underlying inflammatory processes. The aim of this study was to identify immunological subgroups of patients with UC and to test responsiveness to adalimumab in these subgroups in the mouse model of ulcerative colitis (UC), which is based on NOD/scid IL-2Rγ null (NSG) mice reconstituted with peripheral blood mononuclear cells (PBMCs; NSG-UC).

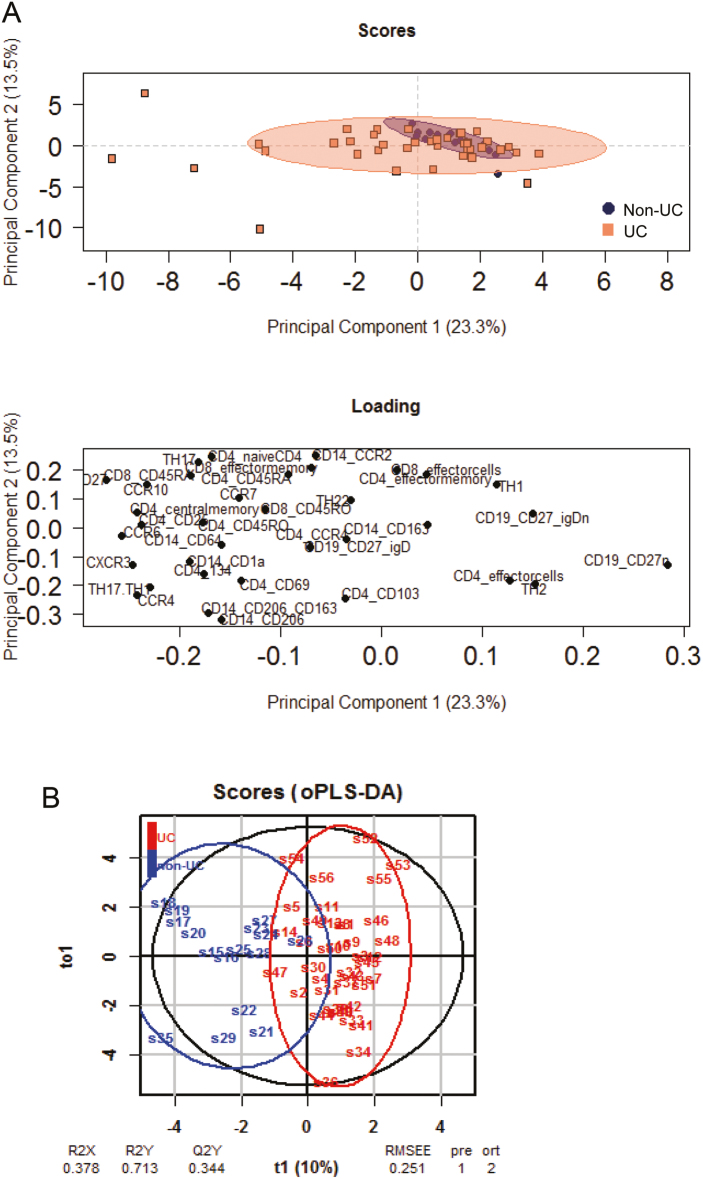
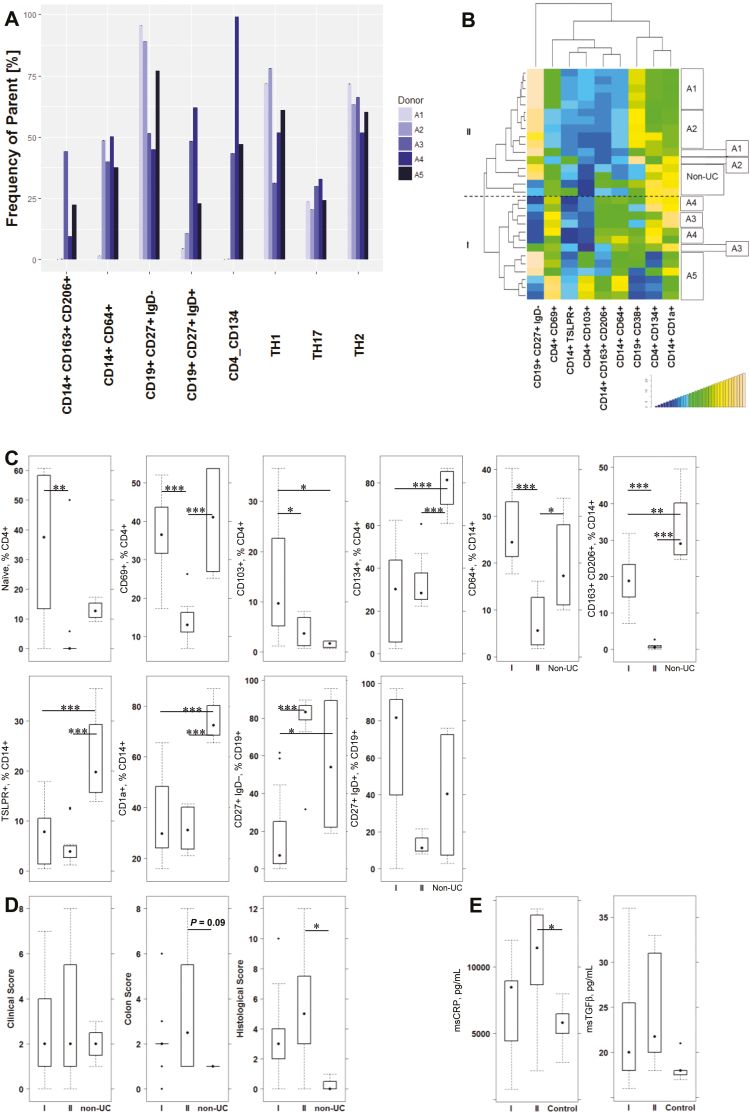
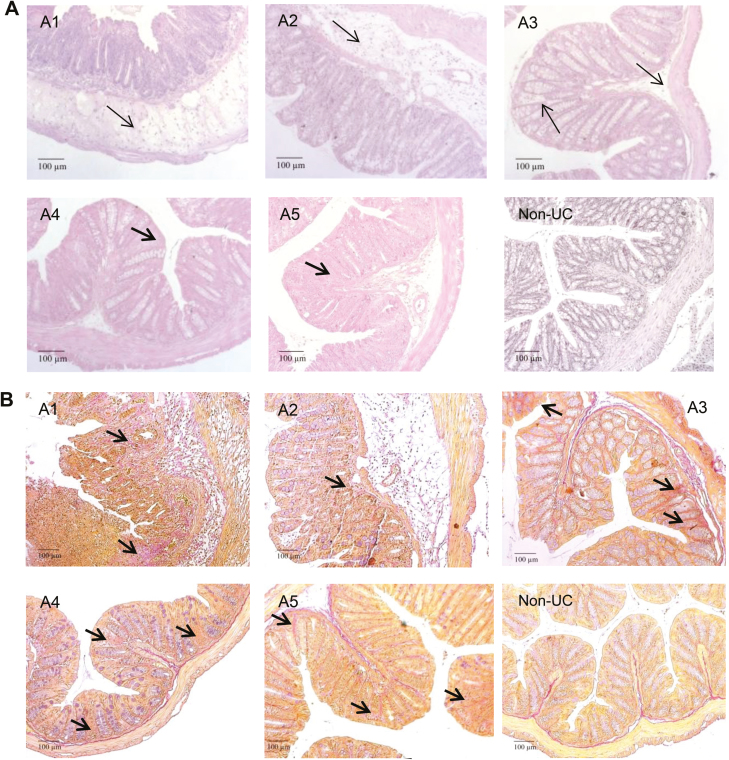
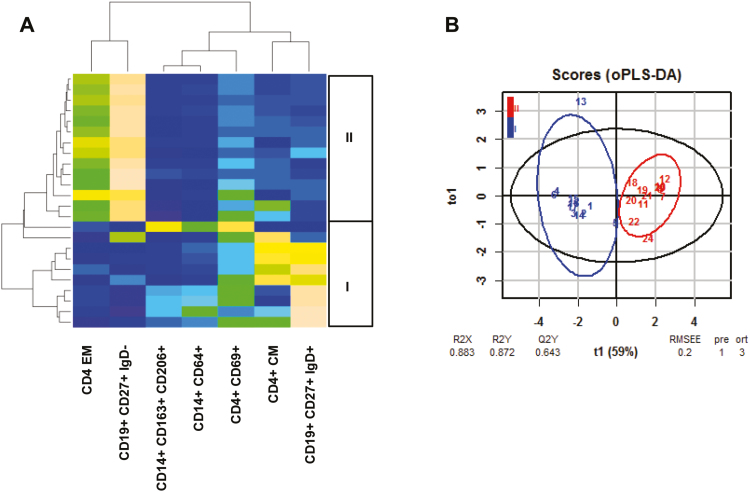
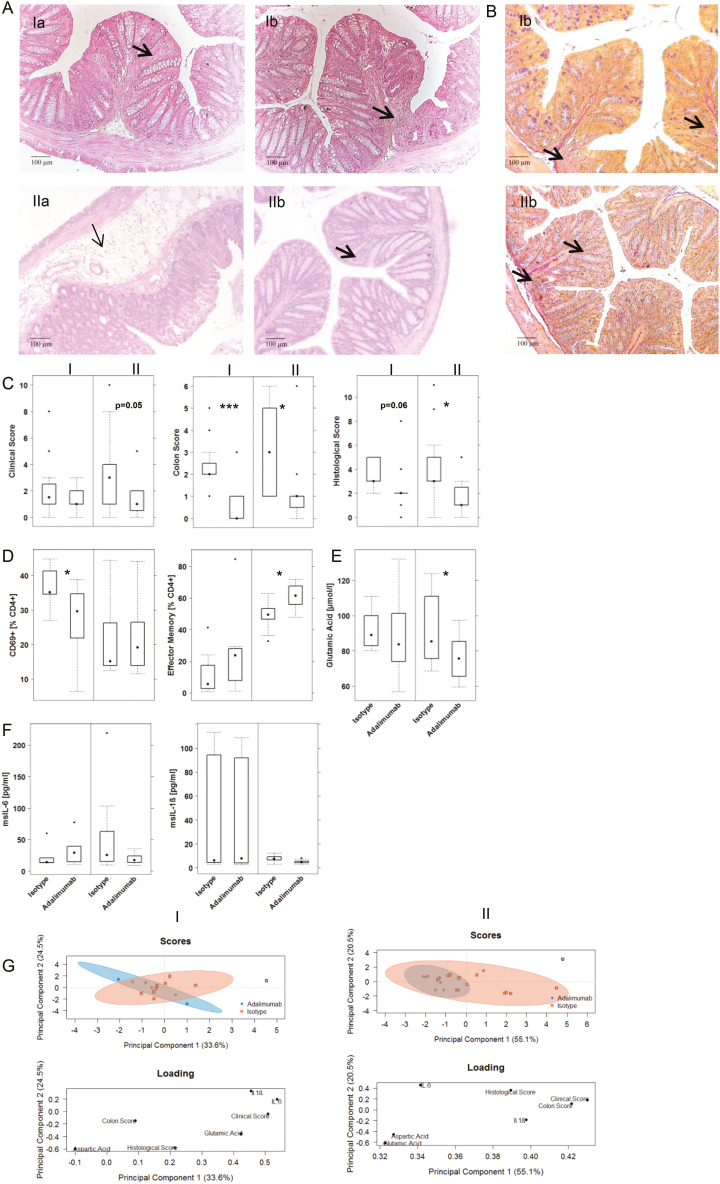
Methods: The immunological profiles of 40 UC patients and 16 non-UC donors were determined by flow cytometric analysis of PBMCs in a snapshot and longitudinal study and analyzed by principal component, orthogonal partial least square discrimination (oPLS-DA), and hierarchical clustering analysis. NSG mice were reconstituted 5 times at consecutive time points with PBMCs from a single donor and were analyzed for frequencies of human leukocytes and histological phenotype. The response to adalimumab of 2 identified subgroups was tested in the NSG-UC model. We used the clinical, colon, and histological score, serum levels of glutamic and aspartic acid, and IL-6 and IL-1ß. Response was analyzed by oPLS-DA.

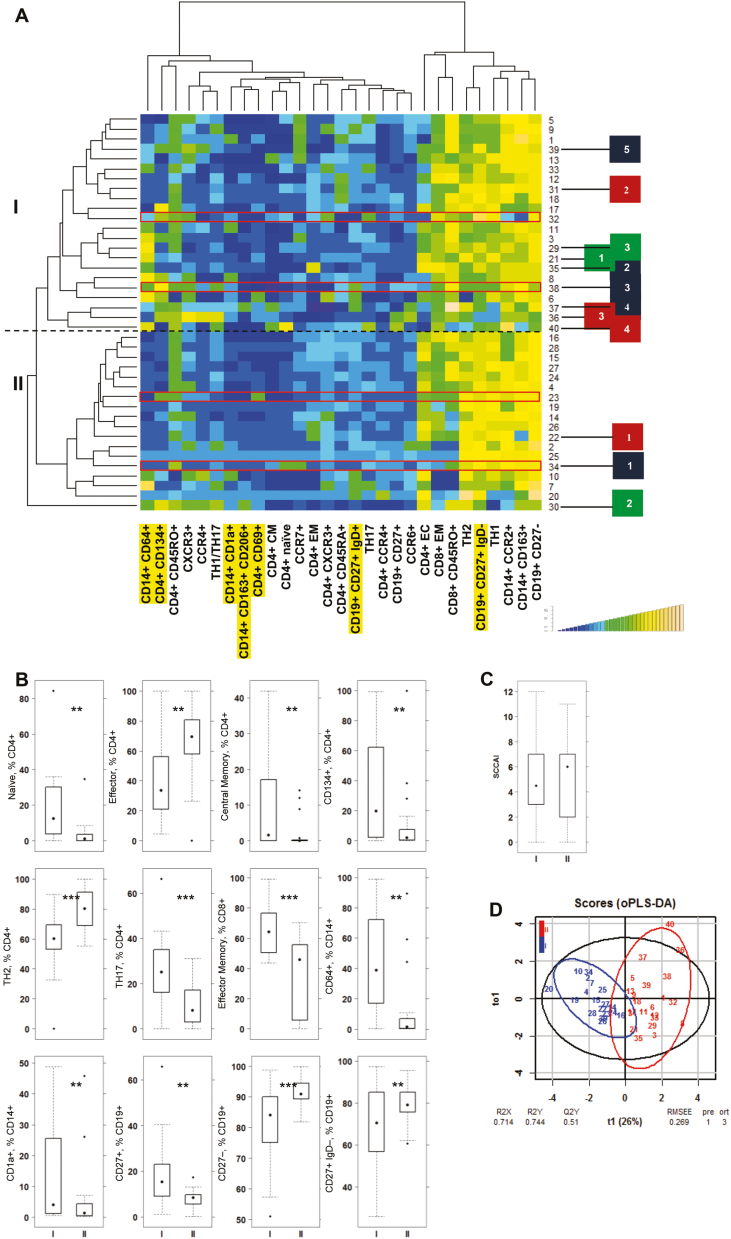
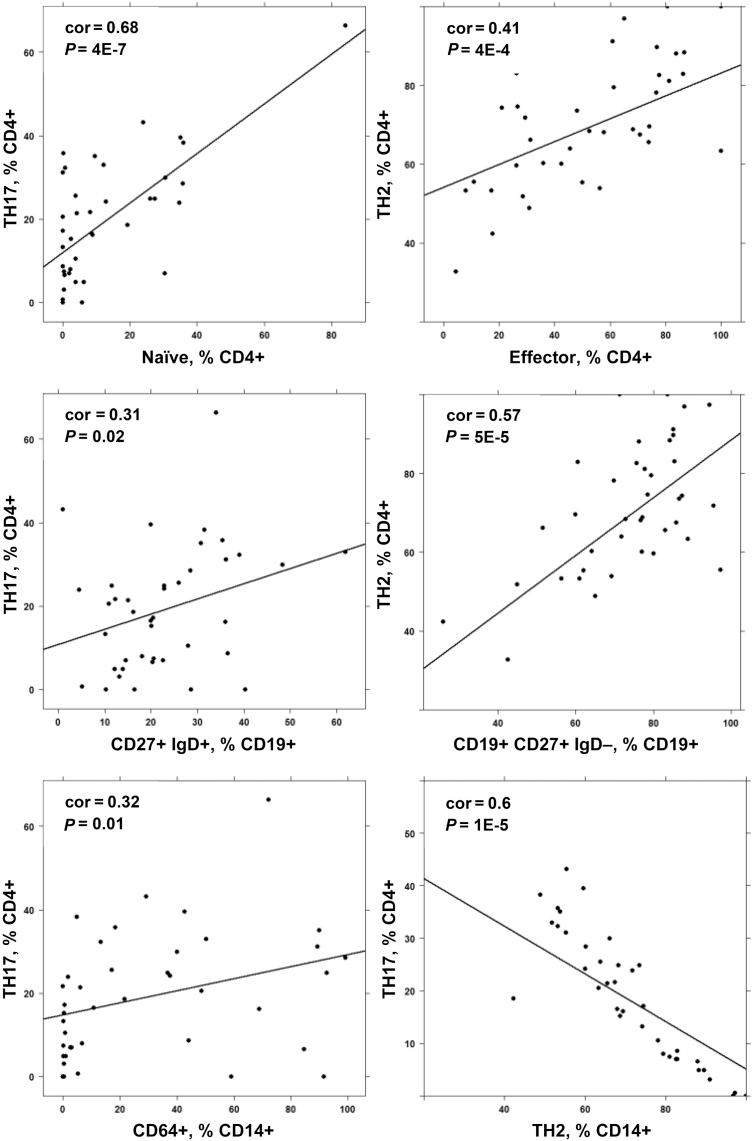
Results: Analysis revealed a distinction between UC and non-UC donors. Hierarchical clustering identified 2 major subgroups in UC patients. Group I was characterized by TH17 and M1 monocytes, group II by TH2/TH1, and switched B cells. These subgroups reflect the dynamics of inflammation as patients. NSG-UC mice achieved an immunological phenotype reflecting the patient's immunological phenotype. oPLS-DA revealed that NSG-UC mice reconstituted with PBMCs from group II responded better to adalimumab.

Conclusions: The combination of profiling and testing of therapeutics in the NSG-UC model may lead to individualized and phase-dependent therapies.

Keywords: NOD/scid IL-2Rγ null; NSG-UC; adalimumab; immunological profiling; inflammatory bowel disease; ulcerative colitis.


Figures

FIGURE 1.
FIGURE 1.
Subgroups of immune cells lead to discrimination of non-UC and UC patients. Profiles of 40 UC and 16 non-UC donors were compared using (A) PCA analysis and (B) oPLS-DA analysis. Abbreviations: R2X, fraction of the variation of the X variables explained by the model; R2Y, fraction of the variation of the Y variables explained by the model; Q2Y, fraction of variation of the y variables predicted by the model.
FIGURE 2.
FIGURE 2.
Patient profiling leads to identification of subgroups of UC. A, Hierarchically clustered heatmap of 40 patients. Subgroups I and II are indicated on the left side. Patients participating in the longitudinal study are indicated as boxes on the right side (blue: patient A, time points 1–5; red: patient B, time points 1–4; green: patient C, time points 1–3). B, Boxplot analysis of frequencies of subtypes of CD4+ and CD8+ T cells, monocytes, and B cells. C, Boxplot analysis of SCCAI score. Boxes represent upper and lower quartiles, whiskers represent variability, and outliers are plotted as individual points. Labels given on x-axes on the bottom and top row apply to all charts. For comparison of groups, a Student t test was conducted (*P = 0.05; **P = 0.01; ***P = 0.001). D, oPLS-DA analysis of patient group I and II. The parameters used were identical to those used for hierarchical clustering. PBMCs selected for testing of responsiveness to adalimumab in the NSG-UC are boxed in red. Labels highlighted in yellow refer to markers used in the animal studies for discriminating groups. Abbreviations: R2X, fraction of the variation of the X variables explained by the model; R2Y, fraction of the variation of the Y variables explained by the model; Q2Y, fraction of variation of the y variables predicted by the model.
FIGURE 3.
FIGURE 3.
Correlation analysis of subtypes of immune cells identifies TH17 and TH2 as opposing immunological pathways. Method = Pearson; numbers display Pearson’s product–moment correlation values (cor) and P values (P).
FIGURE 4.
FIGURE 4.
The immunological phenotype of the donor is partially preserved in the NSG-UC model. NSG mice were reconstituted with PBMCs from patient A isolated at 5 consecutive time points (A1–A5; n = 6 for each experiment) and with PBMCs from a non-UC donor (n = 4). Mice were challenged with 10% ethanol at day 8 and 50% ethanol at day 15. A, Comparison of frequencies of subtypes of T, B, and monocytes in PBMCs from patient A at time points of reconstitution. B, Hierarchical cluster analysis of frequencies of human leukocytes isolated from the spleen of reconstituted mice, analyzed by flow cytometry, and depicted as a heatmap. Boxes on the right side indicate mice reconstituted with PBMCs from patient A at different time points and those of the non-UC donor. I and II indicate the main groups. C, Frequencies of human leukocytes isolated from mouse spleen of groups I and II and the non-UC donor are depicted as boxplots. D, Clinical, colon, and histological scores of mice from groups I and II and the non-UC donor are depicted as boxplots. E, Mouse CRP levels in colons of mice from groups I and II in comparison with levels in unrecontituted mice (control, n = 7). Boxes represent upper and lower quartiles, whiskers represent variability, and outliers are plotted as individual points. Labels given on x-axes on the bottom row apply to all charts. For comparison of groups, a Student t test was conducted (0 ‘***’ 0.001 ‘**’ 0.01 ‘*’ 0.05).
FIGURE 5.
FIGURE 5.
Histological analysis of a section of the distal part of a mouse colon. Mice were treated as described in Figure 4. A1–A5 refers to 5 consecutive studies with PBMCs from donor A, and non-UC refers to a study with PBMC from a non-UC donor. A, Photomicrographs of H&E-stained sections. B, Photomicrographs of Elastica-van-Gieson-stained sections. Arrow indicates edema and influx of inflammatory cells; bold arrow indicates fibrosis.
FIGURE 6.
FIGURE 6.
The NSG-UC model reflects the immunological profile of patients. NSG-UC mice were engrafted with PBMCs derived from UC patients of patient group I (donor n = 2; samples n = 11) or II (donor n = 2; samples n = 13) challenged with 10% ethanol at day 8 and 50% ethanol at day 15 and treated with isotype (isotype n = 12). A, Heatmap of the frequencies of human leukocytes isolated from the spleen of mice treated with isotype. B, oPLS-DA analysis of mouse groups I and II using the same parameters as shown in the heatmap.
FIGURE 7.
FIGURE 7.
NSG mice reconstituted with PMBCs derived from patient groups I and II responded differently to treatment with adalimumab. Mice were engrafted and treated as described in Figure 4. A, Photomicrographs of H&E-stained sections of distal parts of the colon from mice. B, Photomicrographs of Elastica-van-Gieson-stained sections: (a) isotype, (b) adalimumab. Arrow indicates edema and influx of inflammatory cells; bold arrow indicates fibrosis. C, Clinical, colon, and histological scores. D, Frequencies of human leukocytes isolated from the spleen. E, Serum levels of glutamic acid. F, Serum levels of mouse cytokines. Results are depicted as boxplots. Boxes represent upper and lower quartiles, whiskers represent variability, and outliers are plotted as individual points. Labels given on x-axes on the bottom and top row apply to all charts. For comparison of groups, a Student t test was conducted (0 ‘***’ 0.001 ‘**’ 0.01 ‘*’ 0.05). G, PCA analysis.

Similar articles

Cited by

References

    1. Medzhitov R. Inflammation 2010: new adventures of an old flame. Cell. 2010;140:771–776. - PubMed
    1. Werner S, Grose R. Regulation of wound healing by growth factors and cytokines. Physiol Rev. 2003;83:835–870. - PubMed
    1. Föhlinger M, Palamides P, Mansmann U, et al. . Immunological profiling of patients with ulcerative colitis leads to identification of two inflammatory conditions and CD1a as a disease marker. J Transl Med. 2016;14:310:1–16. - PMC - PubMed
    1. Jodeleit H, Al-Amodi O, Caesar J, et al. . Targeting ulcerative colitis by suppressing glucose uptake with ritonavir. Dis Model Mech. 2018;11:1–8. - PMC - PubMed
    1. Jodeleit H, Palamides P, Beigel F, et al. . Design and validation of a disease network of inflammatory processes in the NSG-UC mouse model. J Transl Med. 2017;15:265:1–23. - PMC - PubMed

Publication types

MeSH terms