. 2020 Mar 15;459(2):100-108.
doi: 10.1016/j.ydbio.2019.11.008. Epub 2019 Nov 27.

A single-cell transcriptome atlas for zebrafish development

Affiliations

A single-cell transcriptome atlas for zebrafish development

Dylan R Farnsworth et al. Dev Biol. .

Abstract

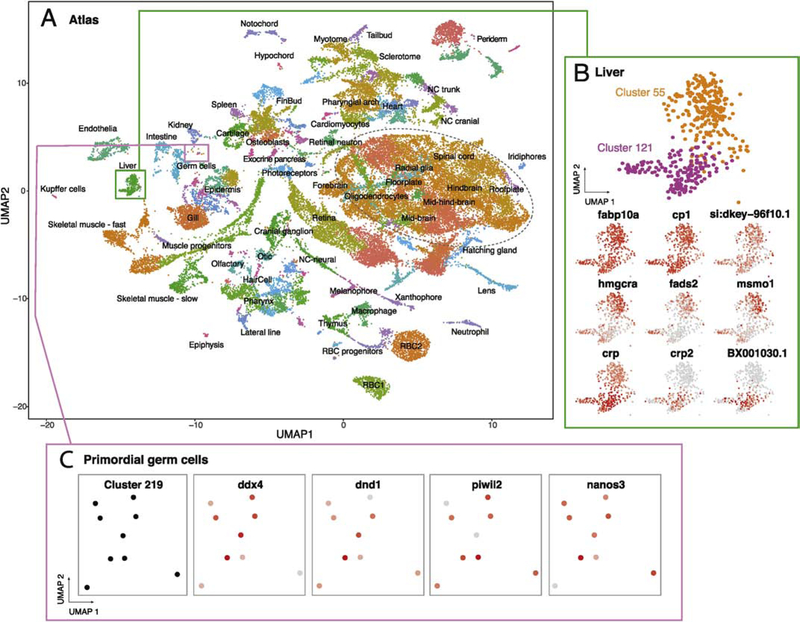
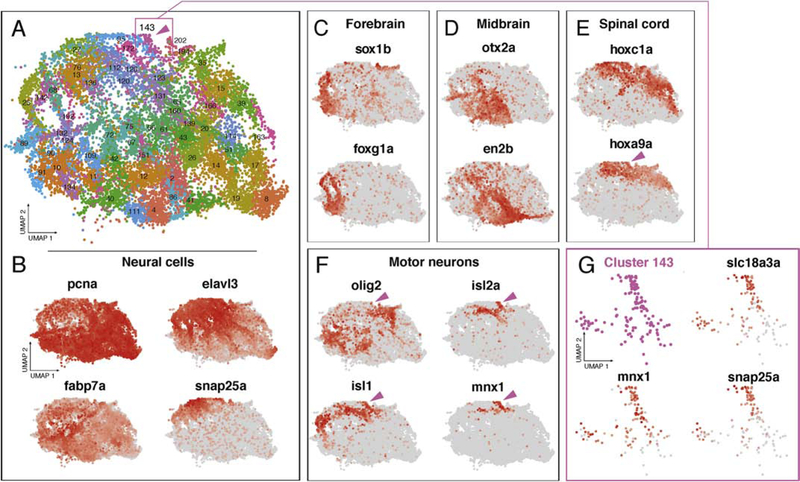
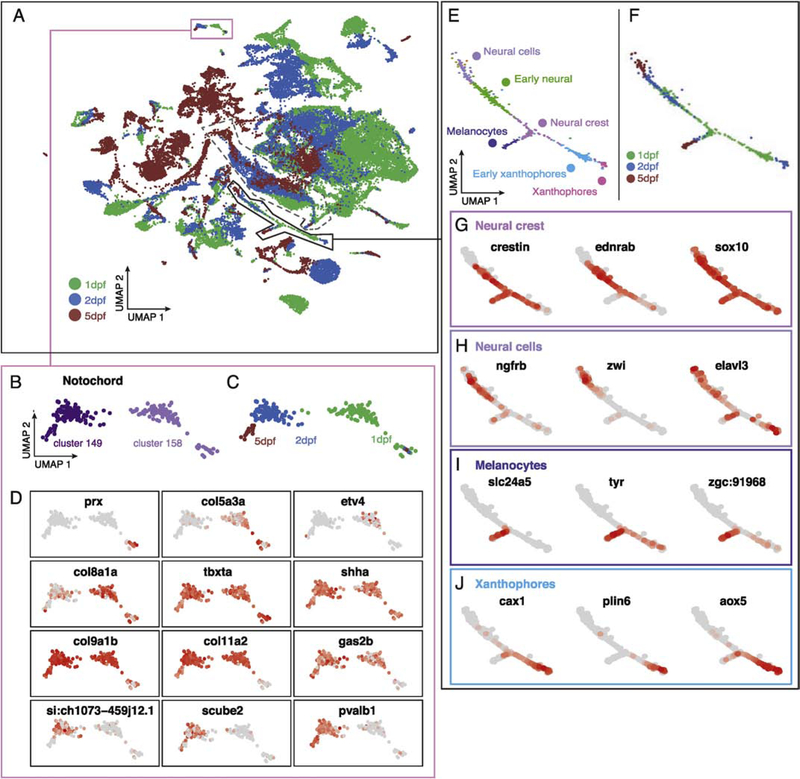
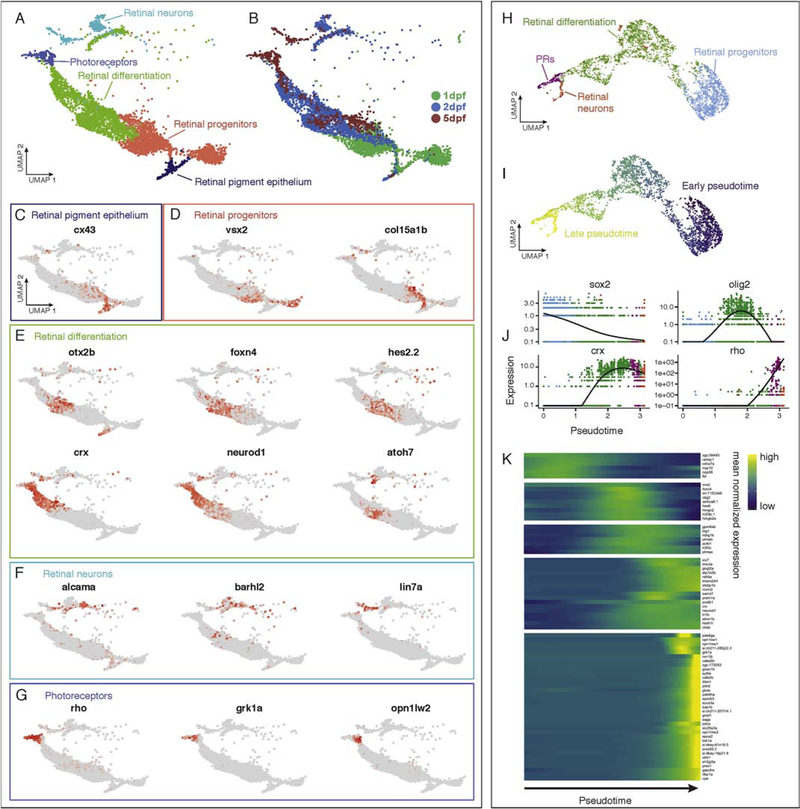
The ability to define cell types and how they change during organogenesis is central to our understanding of animal development and human disease. Despite the crucial nature of this knowledge, we have yet to fully characterize all distinct cell types and the gene expression differences that generate cell types during development. To address this knowledge gap, we produced an atlas using single-cell RNA-sequencing methods to investigate gene expression from the pharyngula to early larval stages in developing zebrafish. Our single-cell transcriptome atlas encompasses transcriptional profiles from 44,102 ​cells across four days of development using duplicate experiments that confirmed high reproducibility. We annotated 220 identified clusters and highlighted several strategies for interrogating changes in gene expression associated with the development of zebrafish embryos at single-cell resolution. Furthermore, we highlight the power of this analysis to assign new cell-type or developmental stage-specific expression information to many genes, including those that are currently known only by sequence and/or that lack expression information altogether. The resulting atlas is a resource for biologists to generate hypotheses for functional analysis, which we hope integrates with existing efforts to define the diversity of cell-types during zebrafish organogenesis, and to examine the transcriptional profiles that produce each cell type over developmental time.


Figures

Figure 1.
Figure 1.
scRNA-seq atlas of developing zebrafish embryos during organogenesis. (A) Clustering of cell types enables gene expression analysis across transcriptional cells types over developmental time. Colors correspond to labels which indicate a grouping of clusters and annotations. Green box describes clusters enlarged in B; pink box describes cluster enlarged in C. Dashed oval approximates the region described in Figure 2. (B) Heterogeneity within hepatocytes is revealed by the identification of two clusters (55 and 121) with different but related gene expression profiles. Common and differential gene expression between these clusters are plotted using red to indicate high levels of expression and grey for low expression (normalized for total expression of the gene, see methods). (C) Rare cells types, including primordial germ cells (PGCs), can be efficiently profiled and are restricted to a single cluster (219). Four markers of PGCs show high levels of expression within this cluster.
Figure 2.
Figure 2.
Spatially restricted gene expression patterns mapped to the atlas. (A) Clusters from the atlas with annotated neural cell identifies. The cells represented correspond to the dashed oval in Figure 1A. Cluster 143 is marked by magenta arrowhead. Magenta box describes location of cluster 143 enlarged in G. (B) Neural maker genes show regions of progenitor (pcna, fabp7a) and differentiated neural identities (elavl3, and snap25a). (C-E) Spatially restricted transcription factors show discrete domains of expression across neural clusters in the atlas. Cells with expression of genes related to the forebrain (sox1b, foxg1a)(C), midbrain (otx2a, en2b)(D), and spinal cord (hoxc1a, hoxa9a)(E), cluster together in the UMAP projection. (F) Combinatorial code of gene expression within hoxa9a expressing domain reveals cluster of putative spinal cord motor neurons expressing markers of the progenitor domain (olig2) and differentiation (isl1, isl2a, mnx1). Cluster 143 marked by magenta arrowhead. (G) Magnified view of cluster 143 shows high levels of motor neuron marker genes slc18a3a and mnx1 and the differentiated neuronal marker snap25a.
Figure 3.
Figure 3.
Temporal gene expression analysis in the atlas using cell age. (A) Aggregating cells from 1, 2, 5 dpf embryos reveals age-related changes in gene expression for discrete clusters. Pink box describes notochord clusters enlarged in B-D; solid black line shows approximate region of neural crest lineages enlarged in E-J. Dashed line shows approximate region of retinal cells described in Figure 4. (B-C) Notochord clusters contain cells of distinct ages. (D) Differential gene expression analysis in developing the notochord. (E) Discrete clusters corresponding to cell type specification in neural crest lineages are annotated with cell-type and color coded by cluster. (F) Age of cells associated with neural crest lineage. (G-J) Differential gene expression analysis over time in neural crest progenitors (G), neural cells (H), melanocytes (I), and xanthophores (J) across developmental time.
Figure 4.
Figure 4.
Temporal and pseudotemporal gene expression analysis of the retina. (A) Retinal cells form continuous transitions in UMAP space. Colors correspond to groupings of clusters and annotations with the cells represented corresponding to the dashed oval in Figure 3A. (B) Age of cells associated with retinal cell clusters. (C-H) Differential expression analysis over time during retina development in clusters of putative (C) retinal pigment epithelium, (D) retinal progenitors, (E) differentiating retinal cells, (F) retinal neurons, and (G) photoreceptors. (H-K) Pseudotemporal analysis of retina neuron development in Monocle. (H) Monocle reconstruction of retinal neural lineages agrees with UMAP analysis and annotation (compare to A). (I) Monocle reconstruction of retinal lineage colored by pseudotemporal age. (J) Monocle analysis reveals progressive repression of sox2, activation of crx and rho, and transient activation of olig2 across pseudotime. (K) Heatmap of gene expression analysis associated with retinal cell type specification in Monocle.

References

    1. Amores A, Force A, Yan YL, Joly L, Amemiya C, Fritz A, Ho RK, Langeland J, Prince V, Wang YL, Westerfield M, Ekker M, Postlethwait JH, 1998. Zebrafish hox clusters and vertebrate genome evolution. Science (80-. ). 10.1126/science.282.5394.1711 - DOI - PubMed
    1. Bayés À, Collins MO, Reig-Viader R, Gou G, Goulding D, Izquierdo A, Choudhary JS, Emes RD, Grant SGN, 2017. Evolution of complexity in the zebrafish synapse proteome. Nat. Commun 10.1038/ncomms14613 - DOI - PMC - PubMed
    1. Bonano M, Tríbulo C, De Calisto J, Marchant L, Sánchez SS, Mayor R, Aybar MJ, 2008. A new role for the Endothelin-1/Endothelin-A receptor signaling during early neural crest specification. Dev. Biol 10.1016/j.ydbio.2008.08.007 - DOI - PubMed
    1. Braasch I, Brunet F, Volff J-N, Schartl M, 2009. Pigmentation Pathway Evolution after Whole-Genome Duplication in Fish. Genome Biol. Evol 10.1093/gbe/evp050 - DOI - PMC - PubMed
    1. Braasch I, Schartl M, Volff JN, 2007. Evolution of pigment synthesis pathways by gene and genome duplication in fish. BMC Evol. Biol 10.1186/1471-2148-7-74 - DOI - PMC - PubMed

Publication types