. 2020 Apr:137:104697.
doi: 10.1016/j.nbd.2019.104697. Epub 2019 Nov 26.

Druggable genome screen identifies new regulators of the abundance and toxicity of ATXN3, the Spinocerebellar Ataxia type 3 disease protein

Affiliations

Druggable genome screen identifies new regulators of the abundance and toxicity of ATXN3, the Spinocerebellar Ataxia type 3 disease protein

Naila S Ashraf et al. Neurobiol Dis. 2020 Apr.

Abstract

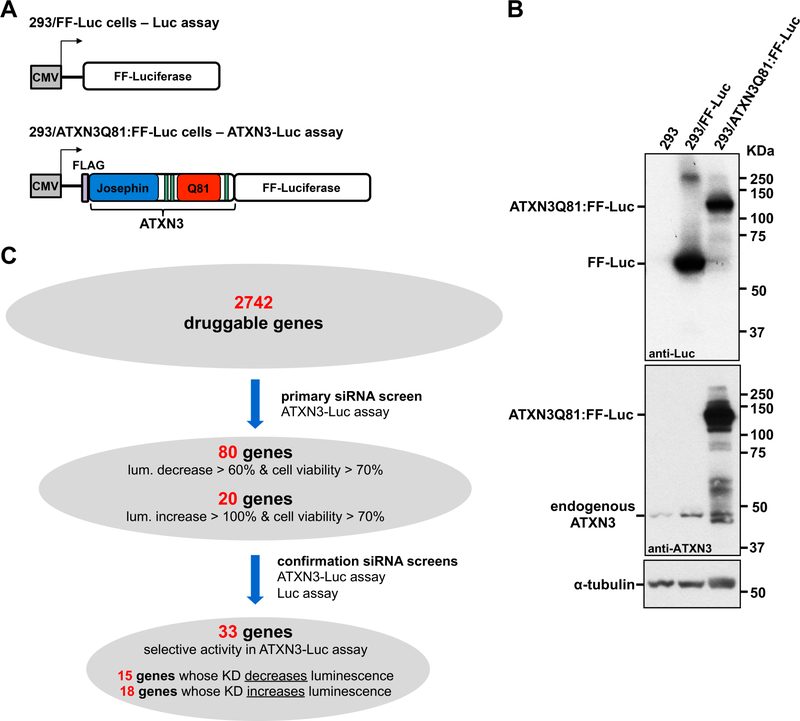
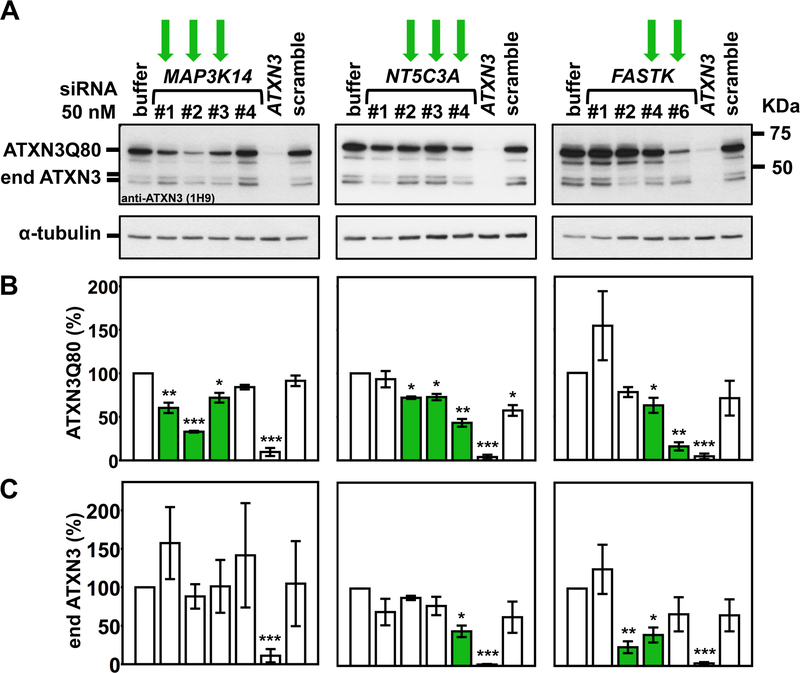
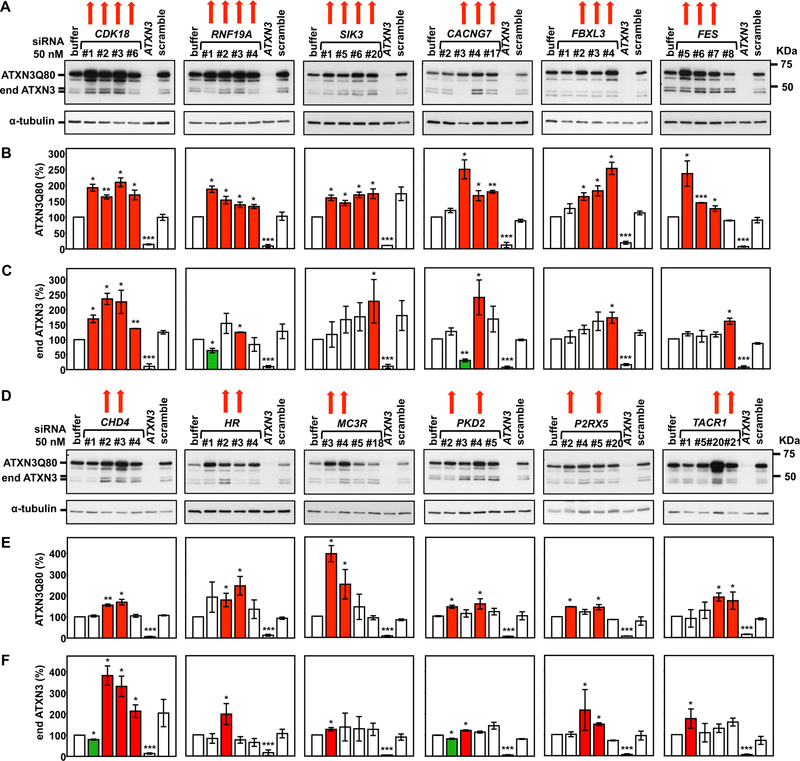
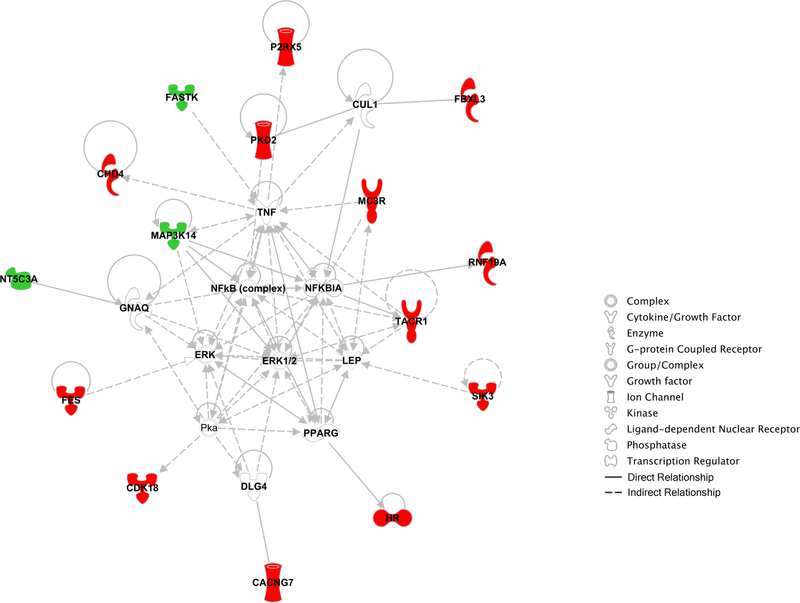
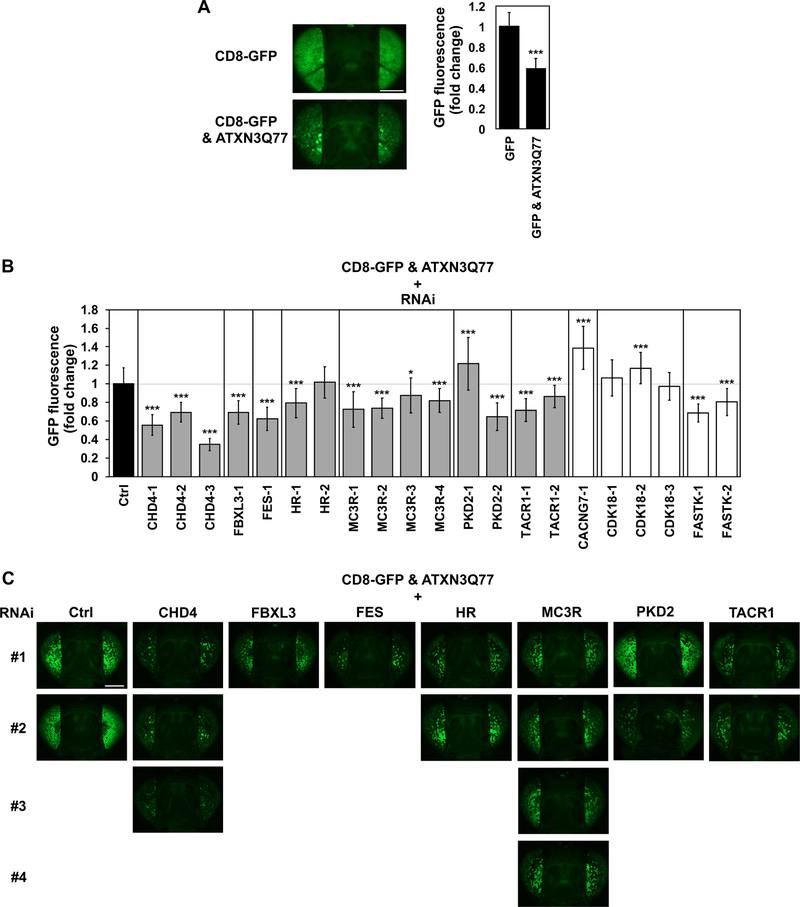
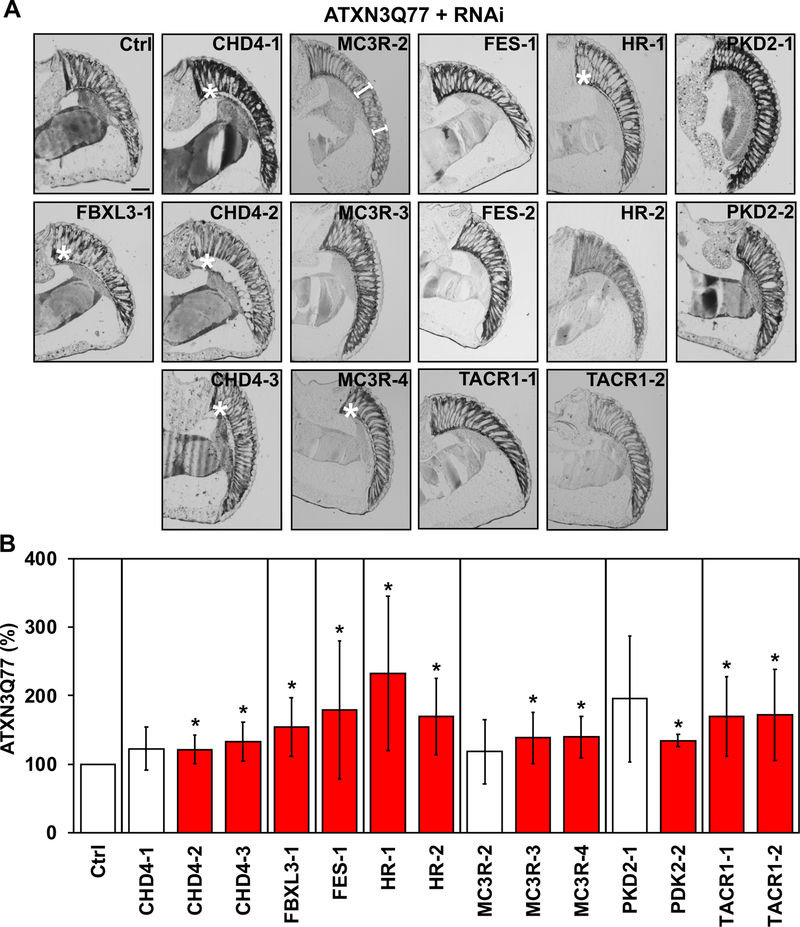
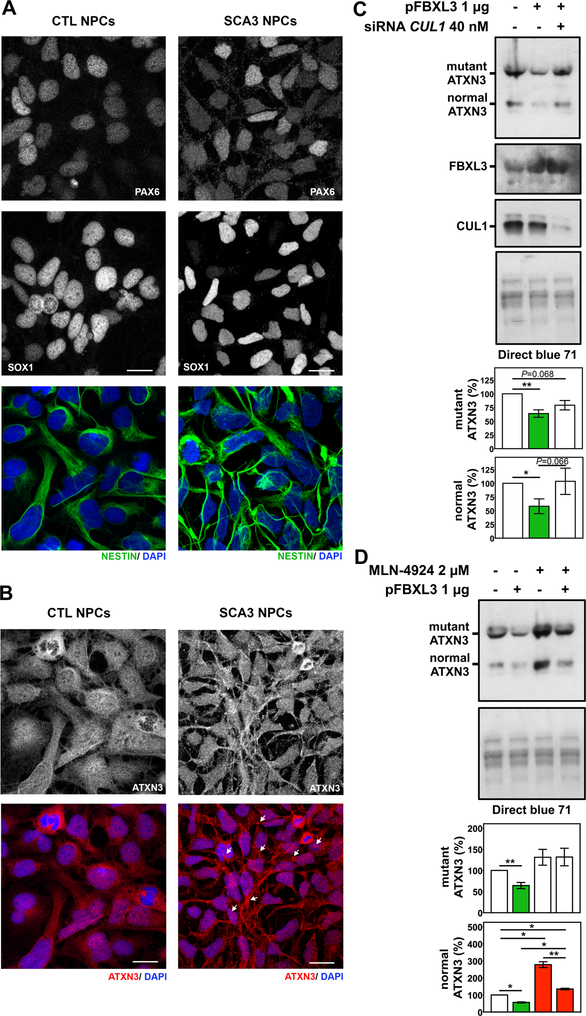
Spinocerebellar Ataxia type 3 (SCA3, also known as Machado-Joseph disease) is a neurodegenerative disorder caused by a CAG repeat expansion encoding an abnormally long polyglutamine (polyQ) tract in the disease protein, ataxin-3 (ATXN3). No preventive treatment is yet available for SCA3. Because SCA3 is likely caused by a toxic gain of ATXN3 function, a rational therapeutic strategy is to reduce mutant ATXN3 levels by targeting pathways that control its production or stability. Here, we sought to identify genes that modulate ATXN3 levels as potential therapeutic targets in this fatal disorder. We screened a collection of siRNAs targeting 2742 druggable human genes using a cell-based assay based on luminescence readout of polyQ-expanded ATXN3. From 317 candidate genes identified in the primary screen, 100 genes were selected for validation. Among the 33 genes confirmed in secondary assays, 15 were validated in an independent cell model as modulators of pathogenic ATXN3 protein levels. Ten of these genes were then assessed in a Drosophila model of SCA3, and one was confirmed as a key modulator of physiological ATXN3 abundance in SCA3 neuronal progenitor cells. Among the 15 genes shown to modulate ATXN3 in mammalian cells, orthologs of CHD4, FBXL3, HR and MC3R regulate mutant ATXN3-mediated toxicity in fly eyes. Further mechanistic studies of one of these genes, FBXL3, encoding a F-box protein that is a component of the SKP1-Cullin-F-box (SCF) ubiquitin ligase complex, showed that it reduces levels of normal and pathogenic ATXN3 in SCA3 neuronal progenitor cells, primarily via a SCF complex-dependent manner. Bioinformatic analysis of the 15 genes revealed a potential molecular network with connections to tumor necrosis factor-α/nuclear factor-kappa B (TNF/NF-kB) and extracellular signal-regulated kinases 1 and 2 (ERK1/2) pathways. Overall, we identified 15 druggable genes with diverse functions to be suppressors or enhancers of pathogenic ATXN3 abundance. Among identified pathways highlighted by this screen, the FBXL3/SCF axis represents a novel molecular pathway that regulates physiological levels of ATXN3 protein.

Keywords: Drosophila; High-throughput screen; Human embryonic stem cells; Machado-Joseph disease; Neurodegeneration; Polyglutamine; Spinocerebellar ataxia.


Conflict of interest statement

Declaration of Competing Interest The authors declare that they have no competing interests.

Figures

Figure 1.
Figure 1.. Unbiased cell-based siRNA screen of the druggable genome identifies novel modulators of ATXN3 levels.
A) Schematic of constructs expressing firefly Luciferase by itself (Luc assay) or FLAG-tagged human ATXN3Q81 fused to Luciferase (ATXN3-Luc assay) in stably expressing HEK293 cell lines. FF: firefly. B) Western blots with anti-ATXN3 (1H9) and anti-Luciferase (Luc) antibodies show expression of ATXN3Q81:FF-Luc fusion protein and FF-Luc, respectively, in ATXN3-Luc and Luc assays. C) Summary of the iterative screens using the ATXN3-Luc and Luc assays to select 33 genes that modulate levels of mutant ATXN3 for subsequent studies.
Figure 2.
Figure 2.. Three identified genes increase pathogenic ATXN3 levels in mammalian cells.
A) Representative ATXN3 Western blots confirm the efficacy of two or more siRNAs targeting MAP3K14, NT5C3, and FASTK in decreasing levels of pathogenic FLAG-tagged human ATXN3Q80 in a stably expressing HEK293 cell line. Green arrows: siRNAs that effectively decrease ATXN3 levels. B, C) Histograms show quantification of ATXN3Q80 (B) and endogenous ATXN3 (end ATXN3) (C) from blots in (A) and another independent experiment. Bars represent the mean percentage of each protein relative to cells transfected with siRNA buffer alone, normalized for α-tubulin (± standard error of mean in two independent experiments). Green bars represent a decrease of ATXN3 levels compared to controls. siRNA # refers to the last digits of the Dharmacon individual catalog number. * 0.026≤P≤0.050, ** 0.003≤P≤0.010, and *** 0.000≤P≤0.001 are from student’s t-tests comparing each siRNA to siRNA buffer control.
Figure 3.
Figure 3.. Twelve identified genes suppress pathogenic ATXN3 abundance in mammalian cells.
A, D) Representative Western blots detecting ATXN3 reveal the efficacy of two or more siRNAs targeting CDK8, RNF19A, SIK3, CACNG7, FBXL3, FES, CHD4, HR, MC3R, PKD2, and P2RX5, TACR1 in increasing levels of mutant ATXN3Q80. Red arrows: siRNAs that effectively increased ATXN3Q80 levels. B, C, E, F) Histograms showing the quantification of ATXN3Q80 (B, E) and endogenous ATXN3 (end ATXN3) (C, F) from blots in (A and D) and another independent experiment. Bars represent the mean percentage of each protein relative to cells transfected with siRNA buffer alone, normalized for α-tubulin (± standard error of mean in two independent experiments). Red and green bars, respectively, represent increased or decreased ATXN3 levels compared to controls. siRNA # refers to the last digits of the Dharmacon individual catalog number. * 0.012≤P≤0.05, ** 0.002≤P≤0.009, and *** 0.000≤P≤0.001 are from student’s t-tests comparing each siRNA to siRNA buffer control.
Figure 4.
Figure 4.. Molecular network formed by genes identified to modulate levels of pathogenic ATXN3 in HEK293 cells.
IPA analysis of 15 genes reveals a molecular network with connections to TNF/NF-kB and ERK1/2 pathways. Genes whose knockdown decreased or increased ATXN3 levels are shown in green or red, respectively. Other genes relevant to the network but not identified as hits in our screen are depicted in grey. Legend for biological function of genes/proteins and gene relationships can be consulted at the left of network.
Figure 5.
Figure 5.. Effect of knockdown of specific fly genes on ATXN3-mediated degeneration.
A) Expression of expanded, full-length, human ATXN3Q77 leads to degeneration in fly eyes, demonstrated by reduced CD8-GFP fluorescence. GMR-Gal4 was used to drive the independent expression of membrane-targeted GFP (CD8-GFP) and mutant ATXN3Q77 in fly eyes. Histograms on the right show quantification of GFP signal from images on the left and additional independent repeats. Scale bar: 200 μM. *** P<0.001 based on student’s t-test comparing GFP signal in the presence of ATXN3Q77 to signal in its absence. N ≥ 30 per genotype (note that these images were collected at a time and with a fluorescent bulb different than the ones in panel C). B) Quantification of the GFP signal from dissected fly heads that expressed pathogenic ATXN3Q77 as well as RNAi targeting the indicated genes. Numbers in RNAi lines indicate independent constructs. Grey bars highlight genes whose knockdown had an effect as expected, based on the observed modulation of ATXN3 levels in mammalian cells, whereas white bars highlight genes with opposite behavior compared to cell-based assays. Shown are means ± standard deviations. N ≥ 30 per genotype. * 0.012≤P≤0.050, and *** 0.000≤P≤0.001 are from student’s t-tests comparing each RNAi line to its respective control. C) Representative images of dissected fly heads expressing CD8-GFP alongside pathogenic ATXN3Q77 in the absence (Ctrl) or presence of RNAi targeting the noted genes (grey bars in (B)). Flies in all panels were seven days old. Numbers on the left side denote different RNAi transgenes used for targeted genes. All flies for the experiments shown here (C) and others that were used for quantification (B) were collected at the same time and imaged with the same fluorescent bulb. Scale bar: 200 μM.
Figure 6.
Figure 6.. Depletion of four fly genes increases ATXN3-dependent toxicity in fly eyes.
A) Representative images of histological sections from fly eyes expressing pathogenic ATXN3Q77 in the absence (Ctrl) or presence of RNAi constructs targeting the indicated genes. Numbers on the left indicate that more than one RNAi line was used for each gene. Scale bar: 50 μM. White asterisks (*) highlight separation of basal retinal structures. White brackets highlight shortening of ommatidial length. B) Graph showing the quantification of ATXN3Q77 protein Western blot bands detected by anti-MJD antibody (Supplementary Figure 6) relative to controls in fly heads from crosses of ATXN3Q77 flies with RNAi lines for selected genes, normalized to total protein levels measured by Direct Blue 71. Bars show means ± standard deviations. N ≥ 3 independent experimental repeats. Red histograms show increased levels of ATXN3 compared to controls. * 0.011≤P≤0.052 is from student’s t-tests comparing each RNAi line to its respective control.
Figure 7.
Figure 7.. FBXL3 suppresses ATXN3 levels in SCA3 neuronal progenitor cells (NPCs).
A) Control (CTRL) and SCA3 NPCs showing immunostaining for NPC markers PAX6 (white), SOX1 (white) and Nestin (green). B) CTRL and SCA3 NPCs immunostained for ATXN3 (red) using anti-MJD antibody. Nuclei were stained with DAPI (blue). Photographs are 2 μm z-stacks acquired by confocal imaging. Scale bar: 25 μM. White arrows point to the larger ATXN3-positive puncta observed in SCA3 NPCs compared to CTRL NPCs. C) Western blots detecting ATXN3 (anti-MJD) in protein extracts of SCA3 NPCs overexpressing FBXL3, with or without concomitant siRNA-mediated knockdown of CUL1 for 48 hours. D) Representative immunoblot blot detecting ATXN3 (anti-MJD) in SCA3 NPCs overexpressing FBXL3 for 48 hr and treated with 2 μM of CUL1 inhibitor MLN-4924 for the final 16 hours. Quantification of bands corresponding to mutant and normal ATXN3 are shown in the accompanying graphs. Bars represent the mean percentage of ATXN3 relative to mock-electroporated cells and normalized to total protein levels measured by Direct Blue 71 (± SEM) in three independent experiments. Red and green bars represent, an increase or decrease, respectively, of ATXN3 levels compared to controls. * 0.019≤P≤0.045 and ** P= 0.001 is from one-tailed t-test comparing the different conditions.

Similar articles

Cited by

References

    1. Aggarwal BB, 2003. Signalling pathways of the TNF superfamily: a double-edged sword. Nat Rev Immunol. 3, 745–56. - PubMed
    1. Alves S, et al., 2008. Allele-specific RNA silencing of mutant ataxin-3 mediates neuroprotection in a rat model of Machado-Joseph disease. PLoS One. 3, e3341. - PMC - PubMed
    1. Alves S, et al., 2010. Silencing ataxin-3 mitigates degeneration in a rat model of Machado-Joseph disease: no role for wild-type ataxin-3? Hum Mol Genet. 19, 2380–94. - PubMed
    1. Ansar M, et al., 2019. Biallelic variants in FBXL3 cause intellectual disability, delayed motor development and short stature. Hum Mol Genet. 28, 972–979. - PMC - PubMed
    1. Ashizawa T, et al., 2018. Spinocerebellar ataxias: prospects and challenges for therapy development. Nat Rev Neurol. 14, 590–605. - PMC - PubMed

Publication types

MeSH terms

LinkOut - more resources