

Membrane Adsorber for the Fast Purification of a Monoclonal Antibody Using Protein A Chromatography
- PMID: 31783640
- PMCID: PMC6950724
- DOI: 10.3390/membranes9120159
Membrane Adsorber for the Fast Purification of a Monoclonal Antibody Using Protein A Chromatography
Abstract
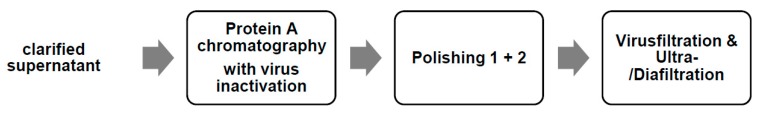
Monoclonal antibodies are conquering the biopharmaceutical market because they can be used to treat a variety of diseases. Therefore, it is very important to establish robust and optimized processes for their production. In this article, the first step of chromatography (Protein A chromatography) in monoclonal antibody purification was optimized with a focus on the critical elution step. Therefore, different buffers (citrate, glycine, acetate) were tested for chromatographic performance and product quality. Membrane chromatography was evaluated because it promises high throughputs and short cycle times. The membrane adsorber Sartobind® Protein A 2 mL was used to accelerate the purification procedure and was further used to perform a continuous chromatographic run with a four-membrane adsorber-periodic counter-current chromatography (4MA-PCCC) system. It was found that citrate buffer at pH 3.5 and 0.15 M NaCl enabled the highest recovery of >95% and lowest total aggregate content of 0.26%. In the continuous process, the capacity utilization of the membrane adsorber was increased by 20%.
Keywords: membrane adsorber; monoclonal antibody; periodic counter-current chromatography; protein A chromatography.
Conflict of interest statement
The authors have declared no conflict of interest.
Figures


Similar articles
-
Continuous purification of Candida antarctica lipase B using 3-membrane adsorber periodic counter-current chromatography.Eng Life Sci. 2018 Apr 30;18(7):414-424. doi: 10.1002/elsc.201700159. eCollection 2018 Jul. Eng Life Sci. 2018. PMID: 32624922 Free PMC article.
-
Development of a polishing step using a hydrophobic interaction membrane adsorber with a PER.C6-derived recombinant antibody.Biotechnol Bioeng. 2010 Feb 1;105(2):296-305. doi: 10.1002/bit.22538. Biotechnol Bioeng. 2010. PMID: 19739096
-
Optimization of continuous purification of recombinant patchoulol synthase from Escherichia coli with membrane adsorbers.Biotechnol Prog. 2019 Jul;35(4):e2812. doi: 10.1002/btpr.2812. Epub 2019 Apr 8. Biotechnol Prog. 2019. PMID: 30932363
-
Basic concepts in Q membrane chromatography for large-scale antibody production.Biotechnol Prog. 2006 Mar-Apr;22(2):341-9. doi: 10.1021/bp050425v. Biotechnol Prog. 2006. PMID: 16599545 Review.
-
Continuous counter-current chromatography for capture and polishing steps in biopharmaceutical production.Biotechnol J. 2016 Sep;11(9):1126-41. doi: 10.1002/biot.201500354. Epub 2016 Jul 4. Biotechnol J. 2016. PMID: 27376629 Review.
Cited by
-
Preparation of Protein A Membrane Adsorbers Using Strain-Promoted, Copper-Free Dibenzocyclooctyne (DBCO)-Azide Click Chemistry.Membranes (Basel). 2023 Oct 6;13(10):824. doi: 10.3390/membranes13100824. Membranes (Basel). 2023. PMID: 37887996 Free PMC article.
-
Developments and opportunities in continuous biopharmaceutical manufacturing.MAbs. 2021 Jan-Dec;13(1):1903664. doi: 10.1080/19420862.2021.1903664. MAbs. 2021. PMID: 33843449 Free PMC article. Review.
-
Streamlined Clarification and Capture Process for Monoclonal Antibodies Using Fluidized Bed Centrifugation and Multi-Column Chromatography With Membrane Adsorbers.Biotechnol Bioeng. 2025 Feb;122(2):382-394. doi: 10.1002/bit.28884. Epub 2024 Nov 18. Biotechnol Bioeng. 2025. PMID: 39558619 Free PMC article.
-
Transport Membrane Condenser Heat Exchangers to Break the Water-Energy Nexus-A Critical Review.Membranes (Basel). 2020 Dec 24;11(1):12. doi: 10.3390/membranes11010012. Membranes (Basel). 2020. PMID: 33374101 Free PMC article. Review.
-
Process- and Product-Related Foulants in Virus Filtration.Bioengineering (Basel). 2022 Apr 4;9(4):155. doi: 10.3390/bioengineering9040155. Bioengineering (Basel). 2022. PMID: 35447715 Free PMC article. Review.
References
-
- Berg J.M., Stryer L., Tymoczko J.L. Stryer Biochemie. Springer; Berlin/Heidelberg, Germany: 2007.
-
- GE Healthcare . Affinity Chromatography Vol. 1: Antibodies. GE Healthcare; Uppsala, Sweden: 2014.
Grants and funding
LinkOut - more resources
Full Text Sources
Other Literature Sources
