. 2019 Nov 29;19(1):338.
doi: 10.1186/s12906-019-2754-7.

1α, 25-dihydroxy Vitamin D3 containing fractions of Catharanthus roseus leaf aqueous extract inhibit preadipocyte differentiation and induce lipolysis in 3T3-L1 cells

Affiliations

1α, 25-dihydroxy Vitamin D3 containing fractions of Catharanthus roseus leaf aqueous extract inhibit preadipocyte differentiation and induce lipolysis in 3T3-L1 cells

Anuj Kumar Borah et al. BMC Complement Altern Med. .

Abstract

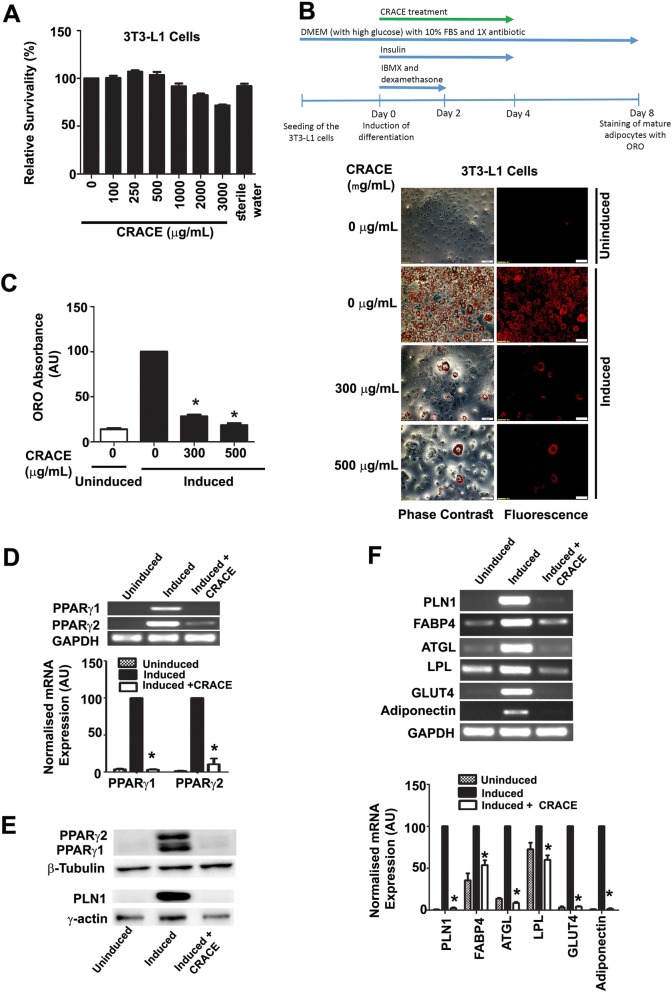
Background: To investigate the potential of Catharanthus roseus leaf aqueous crude extract (CRACE) as a regulator of adipocyte development and function.

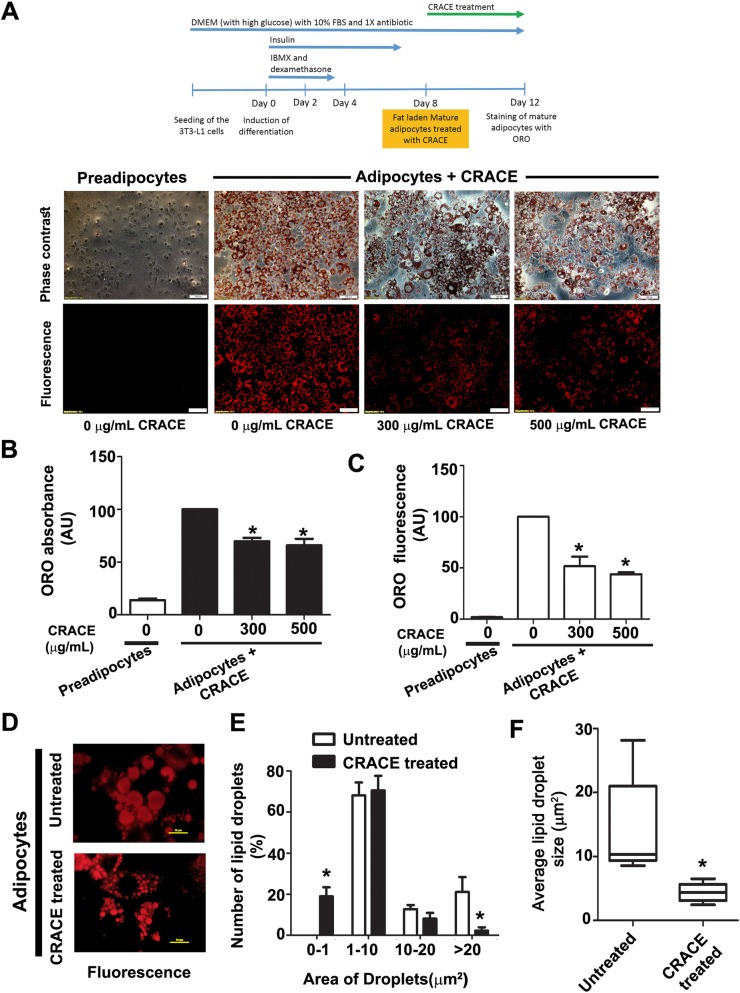
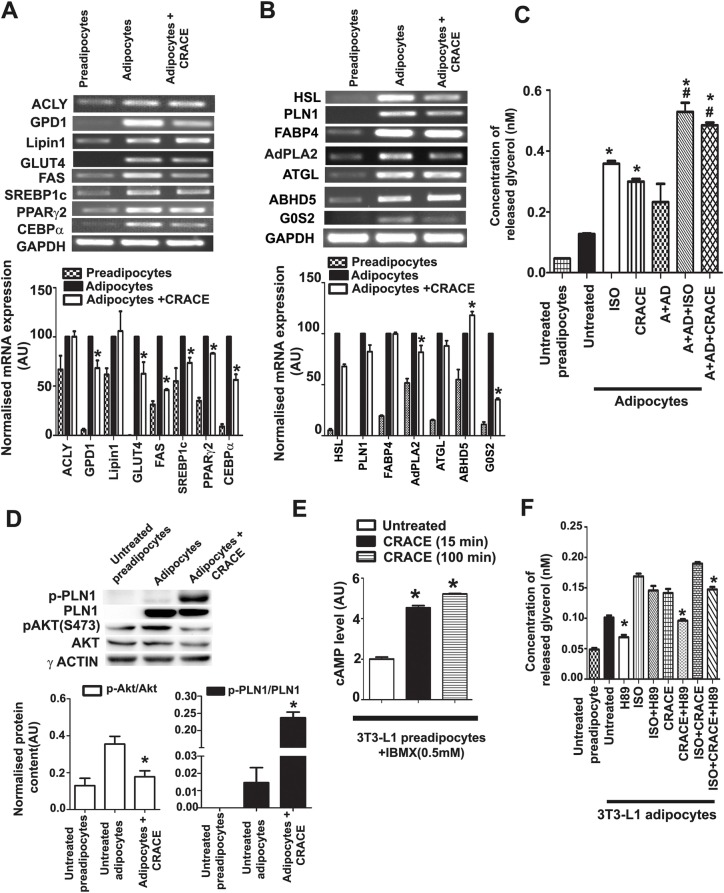
Methods: 3T3-L1 adipogenesis model was used to investigate the effect of CRACE on adipogenesis. 3T3-L1 preadipocytes (for adipogenic differentiation) and mature 3T3-L1 adipocytes (for adipocyte function) were treated with non-toxic doses of CRACE. The outcomes were corroborated by intracellular lipid accumulation, expression of pro-and anti-adipogenic effector molecules. To investigate CRACE mediated lipolysis, cAMP accumulation, glycerol release and phosphorylation of key effector molecules were tested in treated mature adipocytes. Finally, the extract was fractionated to identify the active molecule/s in the extract.

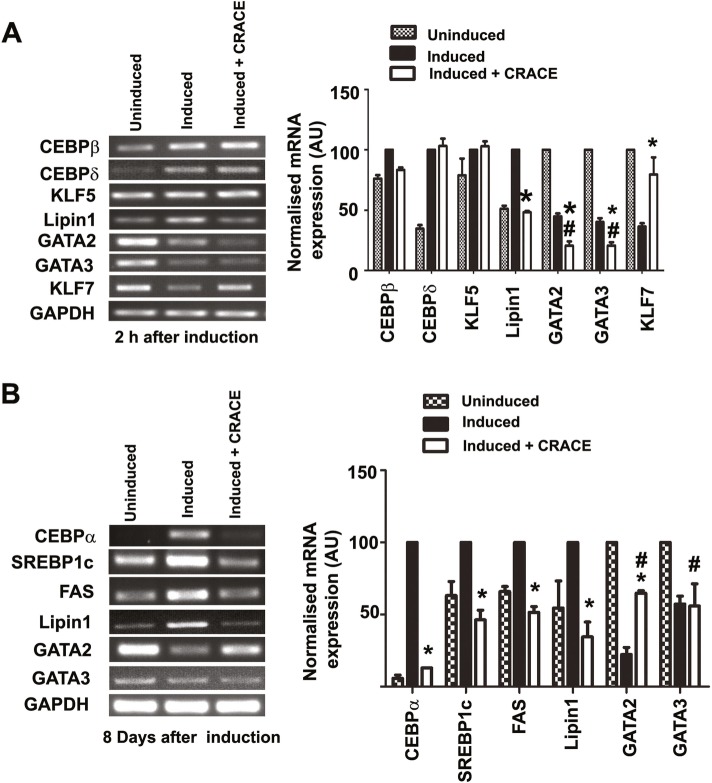
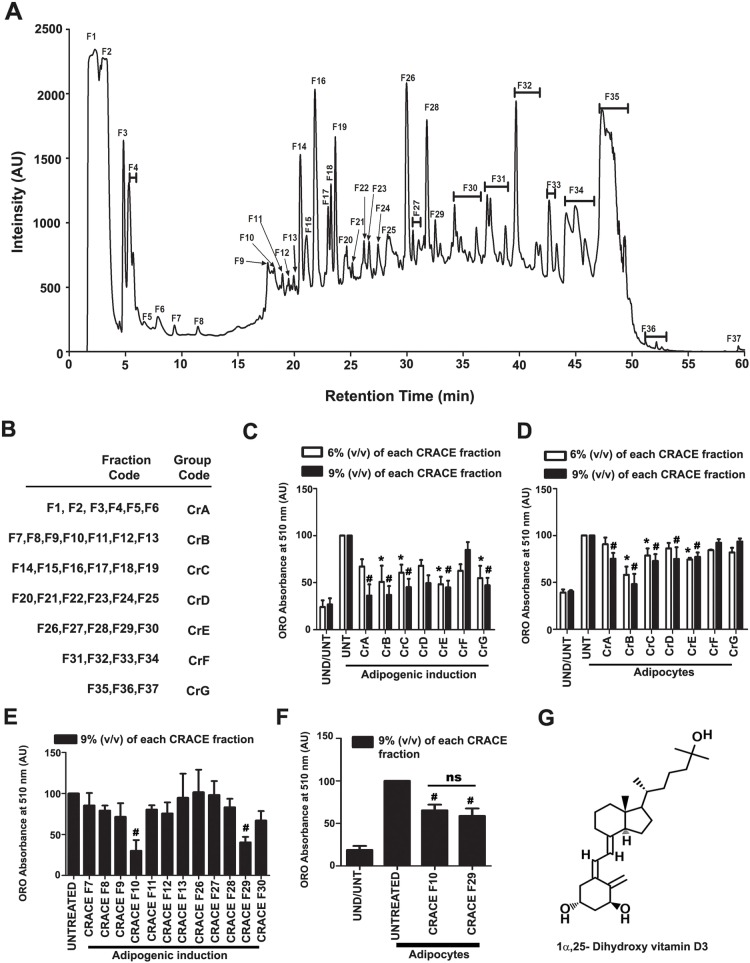
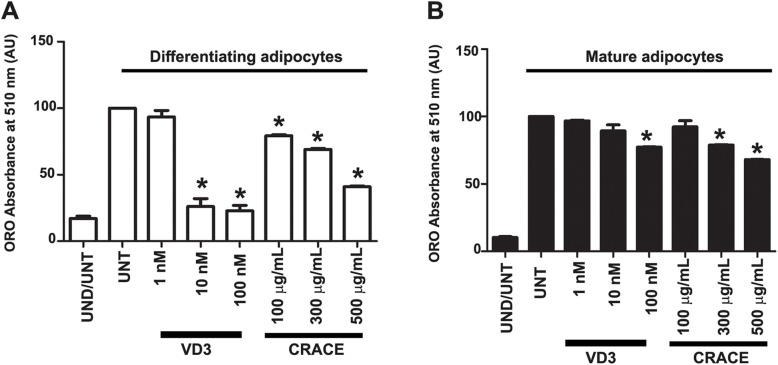
Results: CRACE significantly reduced adipocyte differentiation by modulating PPARγ expression. At early stage CRACE directly targeted Lipin1 expression and consequently impacted KLF7, subsequently expression of GATA2, CEBPα, SREBP1c were targeted, with PPARγ expression, particularly curtailed. While CRACE significantly reduced several lipogenic genes like FAS and GPD1 in mature adipocytes, concomitantly, it greatly increased lipolysis resulting in decreased lipid accumulation in mature adipocytes. The increase in lipolysis was due to decreased Akt activation, increased cAMP level, and PKA activity. The fractionation of CRACE allowed identification of two fractions with potent anti-adipogenic activity. Both the fractions contained 1α, 25-dihydroxy Vitamin D3 as major component.

Conclusions: 1α, 25-dihydroxy Vitamin D3 containing CRACE can be developed into an effective anti-obesity formulation that decreases adipogenesis and increases lipid catabolism.

Keywords: 3T3-L1; Adipogenesis; Catharanthus roseus; Lipolysis; Obesity; Vitamin D3.


Conflict of interest statement

The authors declare that they have no competing interest.

Figures

Fig. 1
Fig. 1
CRACE inhibited differentiation of 3T3-L1 preadipocytes. a. Percent survivability of 3T3-L1 cells as measured by MTT assay after exposure to different doses of CRACE for 24 h. b. CRACE reduced lipid accumulation in differentiating 3T3-L1 cells. Top panel represents the design of the experiment. 3T3-L1 cells were induced with adipogenic cocktail ± CRACE at the displayed doses for 4 days and subsequently kept in maintenance medium for an additional 4 days. Thereafter, ORO staining was performed. Images represent micrographs of ORO stained cells. Scale bar: 100 μm. c. Graph represents absorbance of extracted ORO from different groups of cells represented in panel b. d. Expression of PPARγ1 and PPARγ2 transcripts were reduced in CRACE treated group of induced 3T3-L1 cells. 3T3-L1 cells were induced for differentiation ± CRACE (500 μg/mL equivalent) in the same way as described in panel b. Gel images and bar diagram represent RT-PCR analysis of total RNA isolated after 8 days of induction. e. CRACE reduced PPARγ1, PPARγ2 and PLN1 protein level in differentiating 3T3-L1 cells are represented in panel a. Gel pictures represent western blot analysis of proteins isolated after 8 days of induction. f. CRACE reduced expression of PPARγ target genes. Cell differentiation, and treatment is the same as in panel d. Gel images and bar diagram represent RT-PCR analysis of PPARγ regulated adipocyte factors: PLN1, FABP4, ATGL, LPL, GLUT4, and Adiponectin at 8 days after induction. All bars in the figure represent mean ± SEM, n = 3. p values are from unpaired t-test. * indicates p < 0.05
Fig. 2
Fig. 2
CRACE modulated expression of pro- and anti-adipogenic regulators at early and late stage of adipogenesis. a. Gel images and bar diagram/diagrams represent RT-PCR analysis of early adipogenic regulators expressions in presence and absence of CRACE (500 μg/mL equivalent); after 2 h of induction of adipogenesis in 3T3-L1 cells. b. Gel images and bar diagram represent RT-PCR analysis of adipogenic regulators expressions in presence and absence of CRACE (500 μg/mL equivalent); at the late stage of adipogenesis (8 days post adipogenesis induction in 3T3-L1 cells). Bars represent mean ± SEM. n = 3. GAPDH mRNA expression was used as internal control. Unpaired t-test was performed to study the statistical significance. * represents p < 0.05 for “Induced” vs “Induced + CRACE”. # represents p < 0.05 for “Uninduced” vs. “Induced + CRACE”
Fig. 3
Fig. 3
CRACE decreased lipid accumulation and lipid droplet size in mature adipocytes. 3T3-L1 cells were differentiated to mature adipocytes followed by treatment with CRACE (500 μg/mL equivalent) for 4 days. Lipid content was estimated by ORO staining. a. Top panel represents design of the experiment. Micrographs represent ORO stained preadipocytes and CRACE treated and untreated mature adipocytes at doses of 300 and 500 μg/mL. Scale bars: 100 μm. b and c. Quantification of lipid in cells shown in panel a by ORO elution (b) and by measuring total ORO fluorescence per micrograph frames (c). Bars represent mean ± SEM. For panel b, n = 3. For panel c, n = 10 image frames. Unpaired t-test was performed to study the statistical significance. * p < 0.05 for untreated vs. CRACE treated. d-f. CRACE decreased size of lipid droplets in mature adipocytes. d. High magnification fluorescent micrographs of ORO stained untreated and CRACE treated mature adipocytes are shown in panel a. Scale bars: 10 μm. e. Population distribution of small to large size lipid droplets in the cells shown in panel d. Bars represent mean ± SEM. n = 5 image frames. * p < 0.05 for untreated Vs CRACE treated. One-way ANOVA followed by Bonferroni post-test was performed to evaluate the statistical significance. f. Average lipid droplet size calculated from the data represented in panel e. Box and whisker (minimum to maximum) representation of lipid droplet sizes in each group. Unpaired t-test was performed to study the statistical significance. * p < 0.05 for untreated Vs CRACE treated
Fig. 4
Fig. 4
CRACE reduced lipogenesis and induced lipolysis in mature 3T3-L1 adipocytes by increasing cAMP level and PKA activation. a. mRNA expression analysis of lipogenesis related genes in CRACE treated and untreated mature adipocytes. b. mRNA expression analysis of major players of TAG lipolysis in CRACE treated and untreated mature adipocytes. In panel a and b mature adipocytes received CRACE (500 μg/mL equivalent) for 4 days. Bars represent mean ± SEM. n = 3. * p < 0.05 for untreated vs. CRACE treated. c. Treatment with CRACE (500 μg/mL equivalent) for 3 h increased lipolysis in mature 3T3-L1 adipocytes as measured by glycerol release. Isoproterenol (10 μM) was used as positive control. CRACE also increased lipolysis in cells where basal lipolysis was normalised with 100 nM adenosine (A) and 1 U/mL of adenosine deaminase (AD) treatment. Bars represent mean ± SEM. n = 3. * indicates p < 0.05 for untreated vs. different treatments and # indicates p < 0.05 for A + AD vs. A + AD + different treatments. d. CRACE increased PLN1 phosphorylation and decreased Akt phosphorylation (S473). Mature 3T3-L1 adipocytes were treated with CRACE (500 μg/mL equivalent) for 24 h followed by western blot analysis. Bars represent mean ± SEM, n = 3. * p < 0.05 for untreated vs. CRACE treated adipocytes. e. CRACE (500 μg/mL equivalent) increased intracellular cAMP level in mature 3T3-L1 adipocytes. 0.5 mM IBMX was added in all the cells for cAMP sustenance. Bars represent mean ± SEM, n = 3. * p < 0.05 for untreated vs. treated adipocytes. f. CRACE stimulated lipolysis by PKA activation in mature 3T3-L1 adipocytes. Glycerol release induced in mature adipocytes by CRACE (500 μg/mL equivalent) or isoproterenol in presence or absence of PKA inhibitor H89 was measured. CRACE induced lipolysis was significantly reduced by H89. Bars represent mean ± SEM, n = 3. * p < 0.05 for ‘given treatments’ vs. ‘treatment + H89’ (i.e. Untreated vs H89; CRACE vs CRACE + H89; ISO + CRACE vs ISO + CRACE + H89). Unpaired t-test (for panel 4a, 4b, 4d and 4e) and one-way ANOVA followed by Bonferroni post-test (for panel 4c and 4f) was performed to evaluate the statistical significance
Fig. 5
Fig. 5
1α, 25-dihydroxy vitamin D3 was present in most active fractions in CRACE. a. HPLC Chromatogram of fractionation of CRACE. 200 μL of 10 mg/mL of CRACE was fractionated and later the dried fractions were dissolved again with 200 μL of sterile milli Q water. b. Fractions were grouped into 7 preparations named as CrA, CrB, CrC, CrD, CrE, CrF and CrG. c. CRACE fraction groups CrB and CrE decreased 3 T3-L1 differentiation most efficiently. The cells received treatments with all the grouped CRACE fractions (at 6 and 9% v/v for each fraction) for first 4 days of adipogenic induction. Thereafter, the cells were allowed to be maintained for another 4 days before ORO staining was performed. Bars represent mean ± SEM, n = 3. Two-way ANOVA followed by Bonferroni post-test was performed to evaluate the statistical significance. * indicates p < 0.05 for induced-untreated (UNT) vs. induced- 6% treated. # represents p < 0.05 for induced-untreated (UNT) vs. induced- 9% treated groups. d. Fraction group CrB inhibited lipid accumulation in mature adipocytes most efficiently. Mature adipocytes with equal amount of lipid received treatment with all the grouped fractions (6 and 9% v/v) for 4 days. Post treatment lipid content was measured by ORO staining. Bars represent mean ± SEM, n = 3. Two-way ANOVA followed by Bonferroni post-test was performed to evaluate the statistical significance. * and # indicate same as panel c. e. All the fractions in group b and e were tested in the same manner as C at 9% v/v for their effect on adipocyte differentiation. Fraction F10 and F29 appeared as active fractions in CrB and CrE respectively. Bars represent mean ± SEM, n = 3. One-way ANOVA followed by Bonferroni post-test was performed to the evaluate statistical significance. # indicates same as panel c. f. Fraction F10 and F29 were tested in the same manner as D at 9% v/v for their effect on reduction of fat accumulation in mature adipocytes. Both the fractions reduced accumulated lipid in mature adipocytes. Bars represent mean ± SEM, n = 3. One-way ANOVA followed by Bonferroni post-test was performed to evaluate the statistical significance. # indicates same as panel c. g. 1α, 25-dihydroxy vitamin D3 is the common molecule which is present in F10 and F29 as major constituent
Fig. 6
Fig. 6
Comparison of anti-adipogenic activity of CRACE and pure 1α, 25-dihydroxy vitamin D3. a. Inhibition of preadipocyte differentiation by different doses of CRACE and 1α, 25-dihydroxy vitamin D3 (VD3). b. Treatment of differentiated mature adipocytes with different doses of CRACE and 1α, 25-dihydroxy vitamin D3 reduced lipid accumulation in these cells. In both the experiments 500 μg/mL CRACE had similar effect that of 100 nM pure 1α, 25-dihydroxy vitamin D3. Bars represent mean ± SEM, n = 3. One-way ANOVA followed by Bonferroni post-test was performed to evaluate the statistical significance. * indicates p < 0.05 for induced-untreated (UNT) vs. induced-treated

Similar articles

Cited by

References

    1. Kopelman PG. Obesity as a medical problem. Nature. 2000;404(6778):635–643. doi: 10.1038/35007508. - DOI - PubMed
    1. James WPT. Obesity: a global public health challenge. Clin Chem. 2018;64(1):24–29. doi: 10.1373/clinchem.2017.273052. - DOI - PubMed
    1. Sarjeant K, Stephens JM. Adipogenesis. Cold Spring Harb Perspect Biol. 2012;4(9):a008417. doi: 10.1101/cshperspect.a008417. - DOI - PMC - PubMed
    1. Lee J-E, Schmidt H, Lai B, Ge K. Transcriptional and epigenomic regulation of adipogenesis. Mol Cell Biol. 2019;39(11):e00601–e00618. doi: 10.1128/MCB.00601-18. - DOI - PMC - PubMed
    1. Xu H, Barnes GT, Yang Q, Tan G, Yang D, Chou CJ, Sole J, Nichols A, Ross JS, Tartaglia LA. Chronic inflammation in fat plays a crucial role in the development of obesity-related insulin resistance. J Clin Invest. 2003;112(12):1821–1830. doi: 10.1172/JCI200319451. - DOI - PMC - PubMed