. 2020 Feb 5;105(3):446-463.e13.
doi: 10.1016/j.neuron.2019.10.036. Epub 2019 Nov 26.

Branched Photoswitchable Tethered Ligands Enable Ultra-efficient Optical Control and Detection of G Protein-Coupled Receptors In Vivo

Affiliations

Branched Photoswitchable Tethered Ligands Enable Ultra-efficient Optical Control and Detection of G Protein-Coupled Receptors In Vivo

Amanda Acosta-Ruiz et al. Neuron. .

Abstract

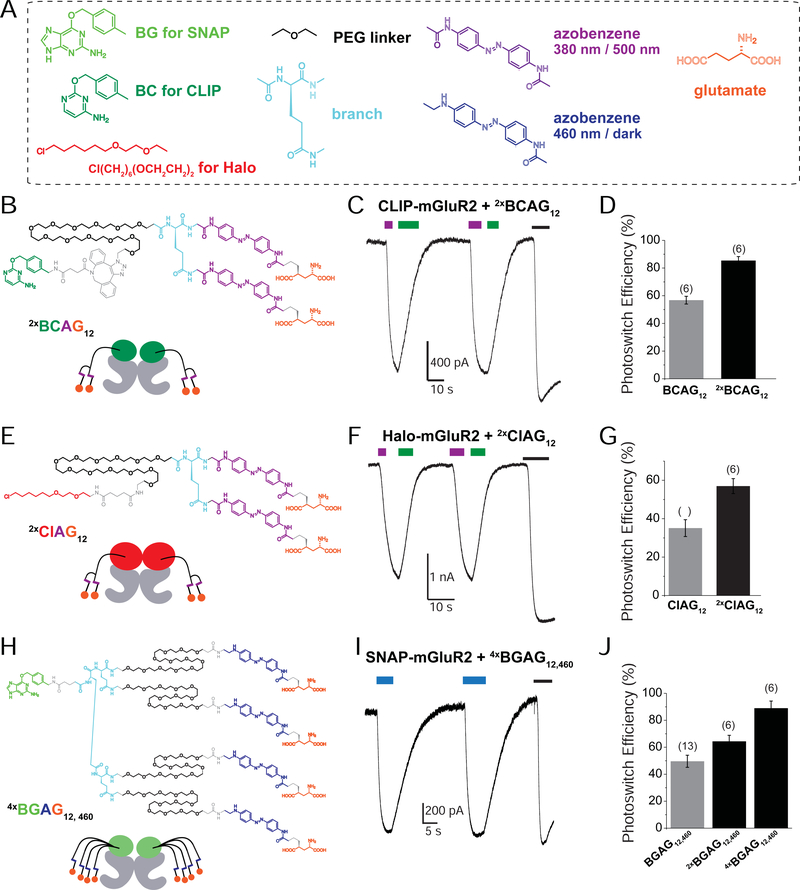
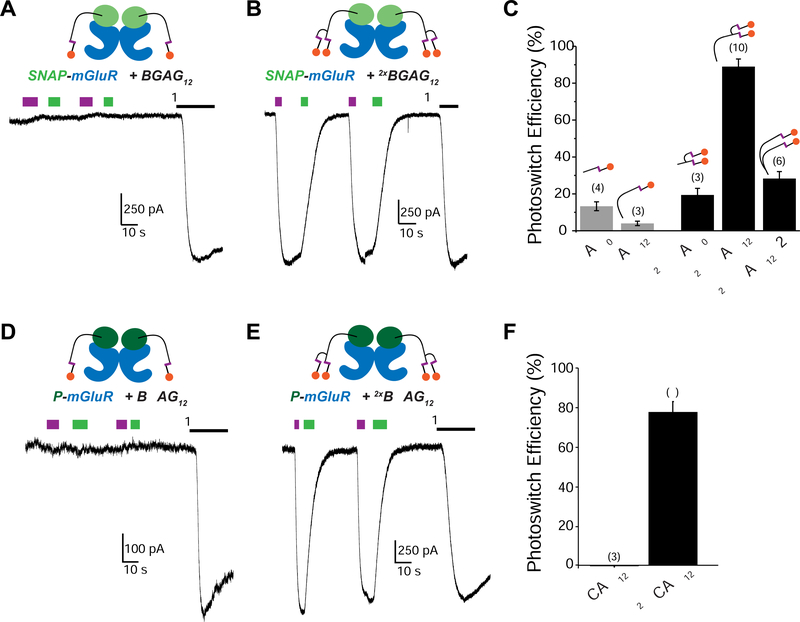
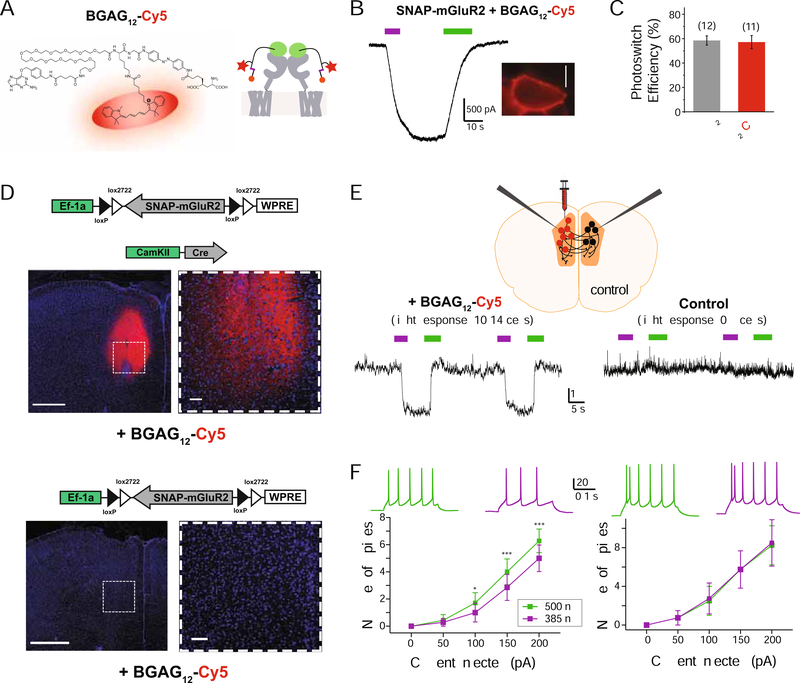
The limitations of classical drugs have spurred the development of covalently tethered photoswitchable ligands to control neuromodulatory receptors. However, a major shortcoming of tethered photopharmacology is the inability to obtain optical control with an efficacy comparable with that of the native ligand. To overcome this, we developed a family of branched photoswitchable compounds to target metabotropic glutamate receptors (mGluRs). These compounds permit photo-agonism of Gi/o-coupled group II mGluRs with near-complete efficiency relative to glutamate when attached to receptors via a range of orthogonal, multiplexable modalities. Through a chimeric approach, branched ligands also allow efficient optical control of Gq-coupled mGluR5, which we use to probe the spatiotemporal properties of receptor-induced calcium oscillations. In addition, we report branched, photoswitch-fluorophore compounds for simultaneous receptor imaging and manipulation. Finally, we demonstrate this approach in vivo in mice, where photoactivation of SNAP-mGluR2 in the medial prefrontal cortex reversibly modulates working memory in normal and disease-associated states.

Keywords: G protein-coupled receptor; astrocyte; calcium signaling; metabotropic glutamate receptor; neuromodulation; optogenetics; photopharmacology; prefrontal cortex; psychosis; working memory.


Conflict of interest statement

Declaration of Interests The authors declare no competing interests.

Figures

Figure 1.
Figure 1.. A Branched Photoswitchable Ligand Enables High Efficiency, Rapid Photo-activation and Photo-deactivation of mGluR2
(A) Schematic showing photo-activation of SNAP-tagged mGluR2 with covalently-tethered “BGAG” photoswitches. Full-length mGluR2 is shown in grey and the genetically-encoded N-terminal SNAP-tag is shown in green. BGAG molecules contain an O6-benzylguanine moiety for SNAP labeling, an azobenzene photoswitch (magenta) and a 4’ tethered L-glutamate (orange circle). (B) HEK 293T whole cell patch clamp trace showing BGAG12-mediated photoactivation of mGluR2 by 385 nm (magenta) and deactivation with 525 nm (green) compared to application of saturating glutamate. (C) Schematic showing branched BGAG concept. The percentage of subunits with an active, cis-BGAG is calculated based on azobenzene photostationary states at 385 nm and the photoactivation efficiency is estimated based on the cooperativity of mGluR2 where agonist binding in one subunit activates 20% relative to binding in both subunits (see Figure S2). (D) Chemical structure of 2xBGAG12. (E-F) Representative whole cell patch clamp recording (E) and summary bar graph (F) showing high efficiency photoactivation of SNAP-mGluR2 via 2xBGAG12. * indicates statistical significance (unpaired t-test, p=0.0004). (G) Kinetics of photo-activation and photo-deactivation of mGluR2 with BGAG12 versus 2xBGAG12. * indicates statistical significance (unpaired t-test, p=0.03). (H-J) 2Representative traces from cortical neurons shows 2xBGAG12-mediated light-induced hyperpolarization (H) and action potential silencing (I) and summary bar graph (J) shows enhanced hyperpolarization for 2xBGAG12. * indicates statistical significance (unpaired t-test, p=0.02). The numbers of cells tested are shown in parentheses. Error bars show s.e.m.
Figure 2.
Figure 2.. Mechanistic Characterization of Branched BGAG-mediated Photoswitching of SNAP-mGluR2
(A-B) trans-2xBGAG12 does not increase basal activation of mGluR2. Representative trace (A) shows that application of saturating LY341495 blocks photoactivation without substantially altering the baseline current level and summary bar graph (B) shows a similarly small effect in the absence or presence of BGAG12 or 2xBGAG12. (C-D) Photoswitching of low affinity SNAP-mGluR2-R57A reveals an enhanced effective concentration of 2xBGAG12 relative to BGAG12. In the absence or presence of glutamate, photocurrents are observed for 2xBGAG12 but not BGAG12. * indicates statistical significance (unpaired t-test, p= 0.01). (E-G) Role of branched BGAG length, branch location and number of branches. Photoswitching of SNAP-mGluR2 with both 2xBGAG12,v2 (E) and 4xBGAG 12 (F) shows high-efficiency photoactivation. Summary bar graph (G) shows photoswitch efficiency for SNAP-mGluR2 with 2xBGAG12, 2xBGAG12,v2, 4xBGAG12, and 2xBGAG0. The numbers of cells tested are shown in parentheses. Error bars show s.e.m.
Figure 3.
Figure 3.. PORTL Branching Enhances mGluR2 Photoactivation in a Range of Modalities.
2(A) Toolset of chemical moieties for mix-and-match design of PORTLs for SNAP, CLIP and Halo-tagged receptors. (B-D) 2xBCAG12 (B) enhances efficiency of CLIP-mGluR2 photoactivation compared to BCAG12. * indicates statistical significance (unpaired t-test, p=0.00008). (E-G) 2xClAG12 (E) enhances efficiency of Halo-mGluR2 compared to ClAG12 (F, G). * indicates statistical significance (unpaired t-test, p=0.006). (H-J) Branching enhances the efficiency of visible light-mediated (blue bar=460 nm) photoactivation of SNAP-mGluR2. * indicates statistical significance (unpaired t-test; p=0.02 between BGAG12,460 and 2xBGAG12,460 and p = 0.009 between 2xBGAG12,460 and 4xBGAG12,460). The numbers of cells tested are shown in parentheses. Error bars show s.e.m.
Figure 4.
Figure 4.. Branched PORTLs Enable Efficient Optical Control of mGluR3.
(A-B) Traces showing photoactivation of SNAP-mGluR3 with BGAG12 (A) or 2xBGAG12 (B). (C) Bar graph showing optimal photoswitching of SNAP-mGluR3 with 2xBGAG12, but not 2xBGAG12,v2 or 2xBGAG0. (D-E) Traces showing photoactivation of CLIP-mGluR3 with BCAG12 (D) or 2xBCAG12 (E). (F) Bar graph showing optimal photoswitching of CLIP-mGluR3 with 2xBCAG12. The numbers of cells tested are shown in parentheses. Error bars show s.e.m.
Figure 5.
Figure 5.. Optical Control of mGluR5 Signaling via Branched PORTLs and a Chimera-Based Approach.
(A) Schematic showing chimera including an N-terminal SNAP tag, the extracellular domains of mGluR2 and the transmembrane and C-terminal domains of mGluR5. (B) GCaMP6 calcium imaging in HEK 293T cells shows light-induced calcium oscillations mediated by SNAP-mGluR2–5 and 2xBGAG12. Right, corresponding images of cells before (top) and during (bottom) subcellular 405 nm illumination (purple dot). 488 nm imaging light is sufficient to rapidly de-activate 2xBGAG12 following 405 nm illumination. (C) Summary of efficiency of optical control of SNAP-mGluR2–5 for BGAG12 versus 2xBGAG12. * indicates statistical significance (Pearson’s chi-square test, p=0.002). (D-E) Increasing the subcellular area of photoactivation increases the probability of a single peak or an oscillatory light response. Data from 38 cells were included in this analysis. (F-G) Increasing the subcellular area of photoactivation does not alter the frequency or amplitude of oscillatory light responses. The summary plot shows data for individual cells (grey lines; n=10 cells) and from an average of all tested cells (black). (H-I) Representative trace shows photoactivation of SNAP-mGluR2–5 with 2xBGAG12 demonstrating an offset in Ca2+ response timing at two distinct ROIs, the photoactivation site in purple and a distal ROI in gray (H). Bar graph (I) shows quantification of Ca2+ wave velocity (d), where n=5 cells and error bars shows s.e.m. (J) Targeted photoactivation of SNAP-mGluR2–5 with 2xBGAG12 leads to oscillatory responses with a simultaneous increase in cytosolic calcium (R-GECO, red) and decrease in endoplasmic reticulum calcium (ER-GCaMP6, green). Right, the response with both sensors spreads from the site of photoactivation to the distal part of the cell.
Figure 6.
Figure 6.. Photoactivation of mGluR5 signaling in astrocytes reveals subcellular confinement of receptor-induced calcium oscillations.
(A-B) Subcellular photoactivation of SNAP-mGluR2–5 with 2xBGAG12 in cultured astrocytes produces reliable calcium oscillations and allows for the visualization of subcellular calcium waves. Photoactivation occurred only at the purple circle in either the soma (A) or a process (B) . Inset highlights that, in this representative cell, calcium oscillations occur at the site of photoactivation, but not in distal sites. (C) Bar graphs shows the range of calcium responses, organized by site of photoactivation and measurement. The number of cells measured are shown inscribed in each bar. A higher proportion of cells showed oscillations in response to photoactivation in processes versus the soma. * indicates statistical significance (comparison between distributions of bar graphs; Pearson’s Chi-Square Test, p=0.037). (D) Calcium oscillation frequencies in response to photoactivation in the processes versus the soma. Lines connect values measured in the same cell with photoactivation in either location. * indicates statistical significance (paired t-test, p=0.017). (E) Schematic showing the properties of calcium oscillations induced by photoactivation in the soma versus a process.
Figure 7.
Figure 7.. Branched Fluorophore-Containing BGAGs Allow Dual Photoactivation and Detection of mGluR2 following in vivo Labeling.
(A) Chemical structure, left, and schematic, right, showing BGAG12-Cy5, a PORTL for dual optical manipulation and sensing of mGluRs. (B) Representative trace, left, and image, right, showing photoactivation and detection of SNAP-mGluR2 in a HEK 293T cell. Scale bars= 10 μm. (C) Bar graph showing comparable photoswitch efficiency relative to saturating glutamate for BGAG12-Cy5 and BGAG12. (D) Top, images showing SNAP-mGluR2 labeled with BGAG12-Cy5 following viral expression and in vivo PORTL injections. Bottom, images showing control slices from mice injected with BGAG12-Cy5 but not expressing SNAP-mGluR2. Scale bars= 500 μm (left) or 50 (right) μm. (E) Top, schematic showing experiment where viral delivery and BGAG12-Cy5 injection is only done in one hemisphere of the medial prefrontal cortex. Bottom, current clamp traces showing light-induced hyperpolarization only in the fluorescent hemisphere and not in the non-fluorescent “control” hemisphere. (F) Input-output curves showing current induced firing for cells in the fluorescent (left) and the non-fluorescent hemisphere (right). Inset shows representative spike firing traces following 525 nm (green) or 385 nm (purple) illumination. Error bars show s.e.m. * indicates statistical significance (2-way ANOVA; current, F(4,24) = 24.84, p = 0.00001; light, F(1,6) = 19.35, p = 0.005; current x light, F(4,24) = 5.65, p = 0.0024; Turkey’s MC test, 385 vs 500 [100 pA, p = 0.007; 150 pA, p = 0.003; 200 pA, p = 0.0007]).
Figure 8.
Figure 8.. in vivo Photoactivation of SNAP-mGluR2 in the Medial Prefrontal Cortex via 2xBGAG12 Reversibly Modulates Mouse Behavior in a Y-maze.
(A) Experimental design where, 6–8 weeks following dual AAV injection and implant placement, 2xBGAG12 is injected into the mPFC 12–16 hours prior to behavioral testing. 385 nm illumination is first applied two minutes before mice enter the Y-maze. (B) Representative image showing bilateral SNAP-mGluR2 expression in the mPFC. To visualize receptors, mice were injected with the SNAP-reactive fluorophore BG-LD55 and slices were imaged. Scale bars= 500 μm (left) or 50 (right) μm. (C) Summary of Y-maze behavioral analysis. The percentage of alternations between different arms of the maze was higher in control mice that either did not receive the 2xBGAG12 injection (“control 1”) or the CaMKII-Cre virus (“control 2”) compared to experimental mice that receive 2xBGAG12 and express SNAP-mGluR2. All mice received the 385 nm photoactivation protocol. * indicates statistical significance (1-way ANOVA; SA F(2,14) = 14.87, p = 0.0003; (Turkey’s MC test [Exp vs Ctrl1 p = 0.004; Exp vs Ctrl2 p = 0.0005]). The number of mice in each group is shown in parentheses. (D-F) Miniature excitatory post-synaptic currents (mEPSCs) (D) recorded in layer 2/3 neurons of the mPFC in coronal slices taken from mice with bilateral expression of SNAP-mGluR2 and labeled with BGAG12-Cy5. Photoactivation leads to a decrease in the frequency (E), but no effect on the amplitude (F), of mEPSCs. * indicates statistical significance (1-way RM ANOVA; Freq, F(2,14) = 4.858, p = 0.02; Fischer’s LD test [BL vs 385, p = 0.01; 385 vs 515 p = 0.02]) (G) Similar effects on mEPSC frequency and amplitude are seen in wild-type mice treated with 100 nM LY379268 compared to SNAP-mGluR2 photoactivation. n=8 cells for each conditions. (H) Representative images showing the expression pattern of tdTomato in Grm2-Cre mice. Scale bars= 10 mm (top) or 100 μm (bottom). (I) Y-maze behavioral analysis in Grm2-Cre mice that express SNAP-mGluR2. The percentage of alternations between different arms of the maze was higher in control mice that did not receive the 2xBGAG12 injection (“control 1”) compared to experimental mice that receive 2xBGAG12 (unpaired T test, p= 0.04). (J) Reversibility experiment demonstrating that delivery of 515 nm light midway through behavioral testing rescued the working memory impairment induced by SNAP-mGluR2 photoactivation in Grm2-Cre mice. * indicates statistical significance (paired t test, p=0.03). (K) When Grm2-Cre mice expressing SNAP-mGluR2 were pre-treated with MK-801 to impair performance the percentage of alternations was higher in experimental mice that received 2xBGAG12 compared to control mice (unpaired T test, p=0.01). The number of mice in each group is shown in parentheses. Error bars show s.e.m.

Comment in

References

    1. Aultman JM, and Moghaddam B. (2001). Distinct contributions of glutamate and dopamine receptors to temporal aspects of rodent working memory using a clinically relevant task. Psychopharmacology (Berl) 153, 353–364. - PubMed
    1. Banghart M, Borges K, Isacoff E, Trauner D, and Kramer RH (2004). Light-activated ion channels for remote control of neuronal firing. Nat Neurosci 7, 1381–1386. - PMC - PubMed
    1. Berry MH, Holt A, Levitz J, Broichhagen J, Gaub BM, Visel M, Stanley C, Aghi K, Kim YJ, Cao K, et al. (2017). Restoration of patterned vision with an engineered photoactivatable G protein-coupled receptor. Nat Commun 8, 1862. - PMC - PubMed
    1. Bocchio M, Lukacs IP, Stacey R, Plaha P, Apostolopoulos V, Livermore L, Sen A, Ansorge O, Gillies MJ, Somogyi P, et al. (2018). Group II Metabotropic Glutamate Receptors Mediate Presynaptic Inhibition of Excitatory Transmission in Pyramidal Neurons of the Human Cerebral Cortex. Front Cell Neurosci 12, 508. - PMC - PubMed
    1. Broichhagen J, Damijonaitis A, Levitz J, Sokol KR, Leippe P, Konrad D, Isacoff EY, and Trauner D. (2015). Orthogonal Optical Control of a G Protein-Coupled Receptor with a SNAP-Tethered Photochromic Ligand. ACS Cent Sci 1, 383–393. - PMC - PubMed

Publication types

Substances