. 2020 Mar;16(3):561-571.
doi: 10.1016/j.jalz.2019.09.079. Epub 2020 Jan 4.

Tau-positron emission tomography correlates with neuropathology findings

Affiliations

Tau-positron emission tomography correlates with neuropathology findings

Val J Lowe et al. Alzheimers Dement. 2020 Mar.

Abstract

Introduction: Comparison of tau (flortaucipir) positron emission tomography (FTP-PET) to autopsy is important to demonstrate the relationship of FTP-PET to neuropathologic findings.

Methods: Autopsies were performed on 26 participants who had antemortem FTP-PET. FTP-PET standardized uptake value ratios (SUVRs) were compared to autopsy diagnoses and Braak tangle stage. Quantitative tau burden was compared to regional FTP-PET signal.

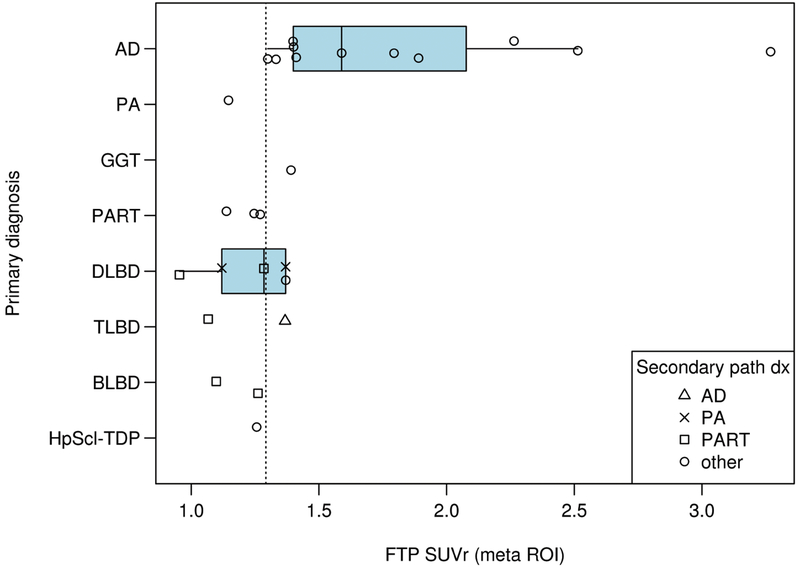
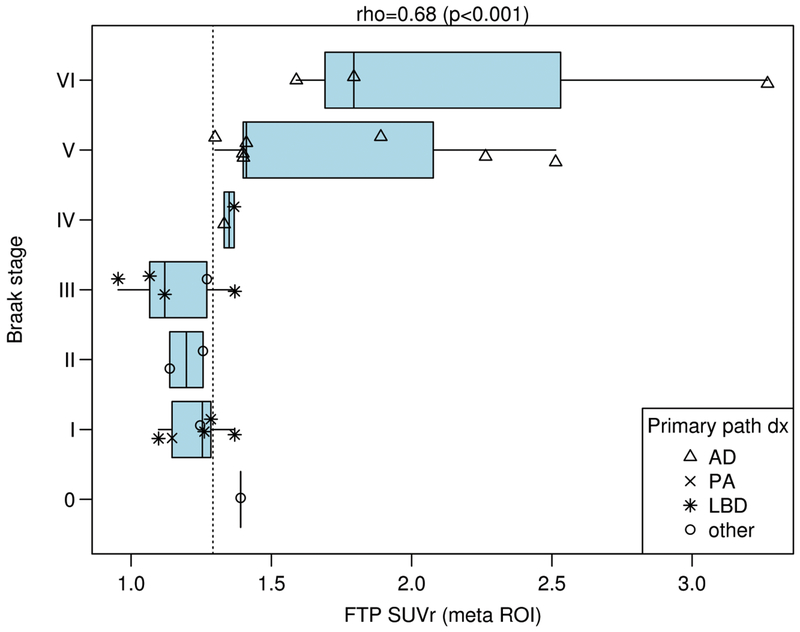
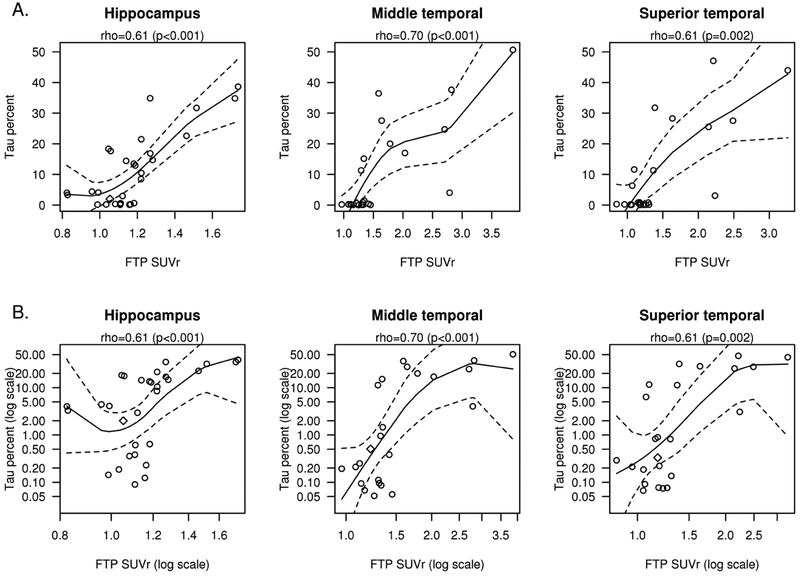
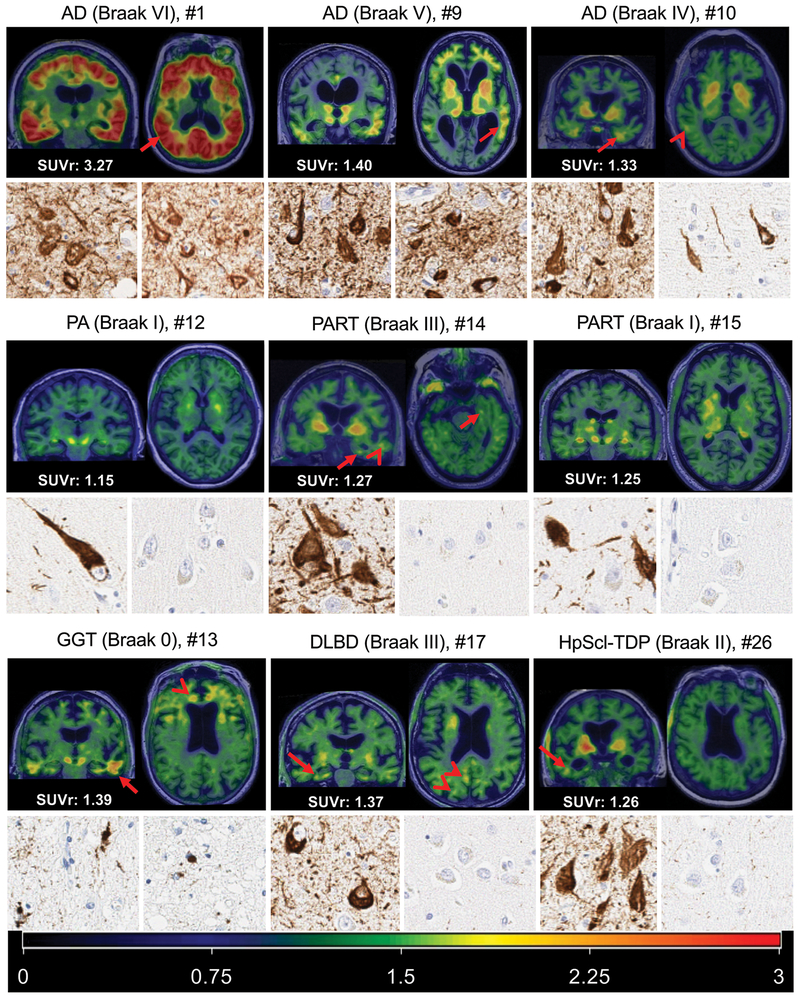
Results: Participants with Braak stages of IV or greater had elevated FTP-PET signal. FTP-PET was elevated in participants with Alzheimer's disease. An FTP-PET SUVR cut point of 1.29 was determined to be optimal. Quantitative measurements of hippocampal and temporal lobe tau burden were highly correlated to FTP-PET signal (rho's from 0.61 to 0.70, P ≤ .02).

Discussion: Elevated FTP-PET reflects Braak IV or greater neuropathology. Participants with primary age-related tauopathy and hippocampal sclerosis did not show elevated FTP-PET signal. Secondary neuropathologic diagnoses of Alzheimer's disease neuropathologic change can lead to borderline elevated FTP-PET signal.

Keywords: Alzheimer's disease; Autopsy; Braak tangle stage; PET; Tau; flortaucipir.


Figures

Figure 1.
Figure 1.. SUVr by Different Primary Neuropathologic Diagnoses.
FTP-PET SUVr using the meta ROI is shown on the x-axis relative to the different primary neuropathologic diagnoses on the y-axis. Each participant’s secondary neuropathologic diagnosis shown in the right lower callout with different shapes indicating the secondary diagnoses. The vertical dotted line represents the SUVr value of 1.29. A two-sample t-test suggested that ADs had more SUVr load on average (mean FTP SUVr) than LBD (1.83 to 1.21, p=0.008).
Figure 2.
Figure 2.. SUVr by Braak NFT Stage.
FTP-PET SUVr using the meta ROI is shown on the x-axis relative to the Braak NFT stage on the y-axis. Each participant’s primary neuropathologic diagnosis is shown in the right upper callout with different shapes indicating the secondary diagnoses. The vertical dotted line represents the SUVr value of 1.29. Only the AD group approached significance for subgroup correlation with Braak stage (p=0.13) but low participant numbers by subgroups were likely a limitation. After adjusting for time from imaging to death, the partial Spearman’s rank correlation between Braak and TAU SUVR is unchanged at 0.67 with 95% confidence interval (CI) (0.34, 0.85) vs. 0.68 (95% CI: 0.40, 0.85) when unadjusted.
Figure 3.
Figure 3.. Correlations between %Tau Burden and SUVR.
FTP-PET SUVr correlation to the % tau burden measured on immunohistochemistry is shown for the hippocampus, middle temporal, superior temporal ROIs (A). The x and y axes are also shown in log scale (B) to better demonstrate the tau-PET SUVr values with low percentage tau burden regions. Includes local regression curves (black) with 95% confidence band (dashed lines). The AGD participant is shown with a diamond shape.
Figure 4.
Figure 4.. FTP-PET images and corresponding histology in AD, Pathological Aging, PART, GGT, DLBD, and Hippocampal Sclerosis.
Coronal and axial images are show for each participant registered to their own MRI. The SUVr value for each is shown in the bottom left of each respective set of images and visually elevated focal uptake (greater than background) is described. The representative color scale with SURr values is shown in the bottom panel. Below the FTP-PET images is a 10x magnification for each participant of the transentorhinal cortex and middle temporal cortex. The AD examples show elevated FTP-PET signal (arrows) corresponding to Braak tangle stage. In the Braak IV AD participant, subtle FTP-PET signal in the posterior temporal region (arrowhead) is also seen. The participant with PA (middle left) had a non-elevated SUVr (1.15) with no visible FTP-PET signal in the entorhinal cortex or temporal lobes. The participant with PART and Braak III (middle row, center) had a non-elevated SUVr (1.27) with visible FTP-PET signal in the entorhinal/temporal gyrus (arrows) and lateral temporal lobe (arrowhead). The participant with PART and Braak I (middle right) had a non-elevated SUVr (1.25) without visible FTP-PET signal. The GGT participant had elevated focal tau accumulation in temporal (arrow) and frontal lobes (arrowhead). The participant with DLBD (lower row, middle), had elevated FTP-PET signal in temporal (arrow), posterior cingulate and parietal-occipital regions (arrowheads). FTP-PET signal is focally elevated in the hippocampal sclerosis participant (bottom row, right) in the right inferior temporal region which was not the side evaluated at autopsy. The AD examples show reduction in tau burden on histology from left to right most notably in the temporal tissue sample. The middle row of low Braak participants show no middle temporal gyrus tau and greater transentorhinal tau burden in the PART Braak III tissue. In the bottom row, globular oligodendroglial inclusions were found in the cortex of the GGT participant, but not neurofibrillary tangle pathology. Neurofibrillary tangle pathology was observed in the transentorhinal region in both DLBD and HpScl-TDP participants with minimal neuritic pathology observed in the middle temporal cortex of DLBD and none found in the HpScl-TDP participant.

References

    1. Braak H, Braak E. Neuropathological stageing of Alzheimer-related changes. Acta Neuropathol. 1991;82:239–59. - PubMed
    1. Braak H, Alafuzoff I, Arzberger T, Kretzschmar H, Del Tredici K. Staging of Alzheimer disease-associated neurofibrillary pathology using paraffin sections and immunocytochemistry. Acta Neuropathol. 2006;112:389–404. - PMC - PubMed
    1. Bennett DA, Schneider JA, Wilson RS, Bienias JL, Arnold SE. Neurofibrillary tangles mediate the association of amyloid load with clinical Alzheimer disease and level of cognitive function. Arch Neurol. 2004;61:378–84. - PubMed
    1. Duyckaerts C, Bennecib M, Grignon Y, Uchihara T, He Y, Piette F, et al. Modeling the relation between neurofibrillary tangles and intellectual status. Neurobiol Aging. 1997;18:267–73. - PubMed
    1. Nelson PT, Alafuzoff I, Bigio EH, Bouras C, Braak H, Cairns NJ, et al. Correlation of Alzheimer disease neuropathologic changes with cognitive status: a review of the literature. J Neuropathol Exp Neurol. 2012;71:362–81. - PMC - PubMed

Publication types