. 2019 Dec 23;146(24):dev178202.
doi: 10.1242/dev.178202.

Lar maintains the homeostasis of the hematopoietic organ in Drosophila by regulating insulin signaling in the niche

Affiliations

Lar maintains the homeostasis of the hematopoietic organ in Drosophila by regulating insulin signaling in the niche

Harleen Kaur et al. Development. .

Abstract

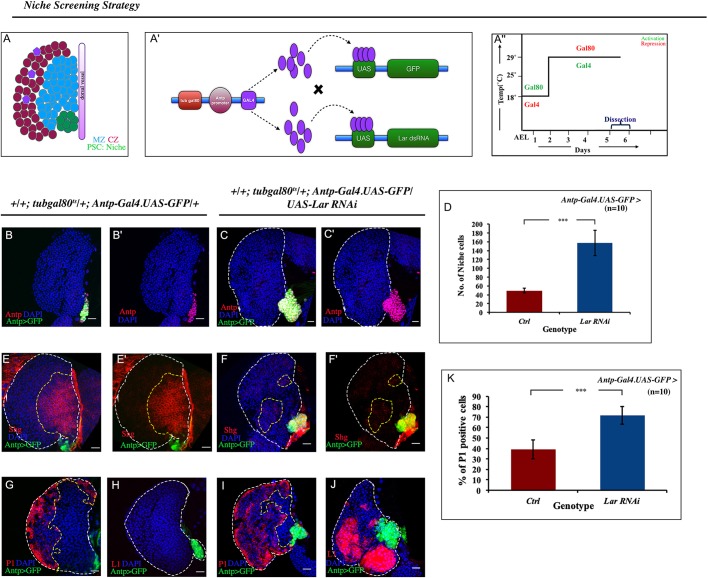
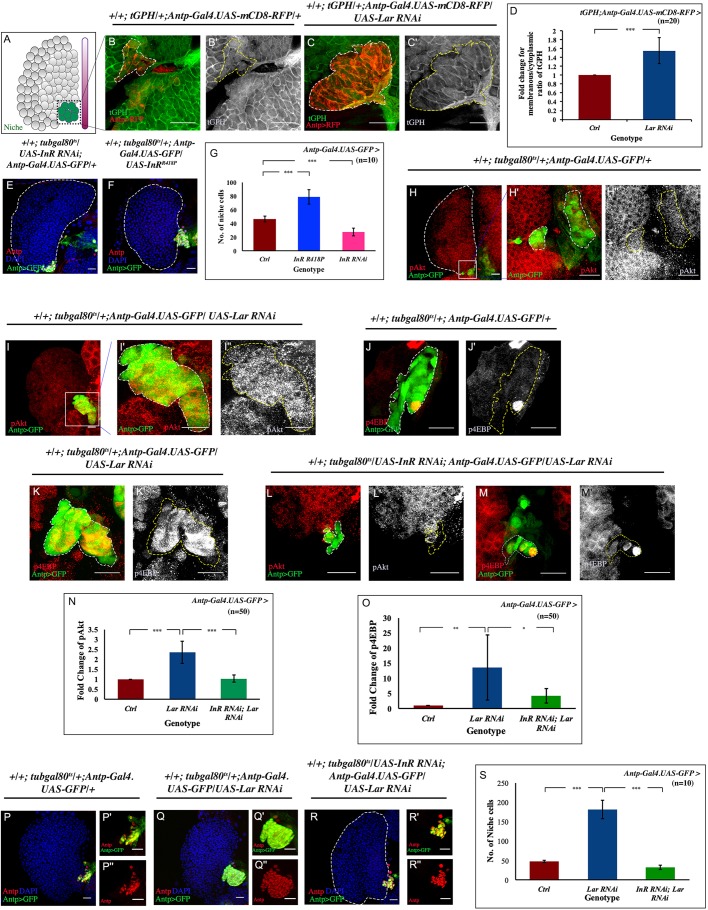
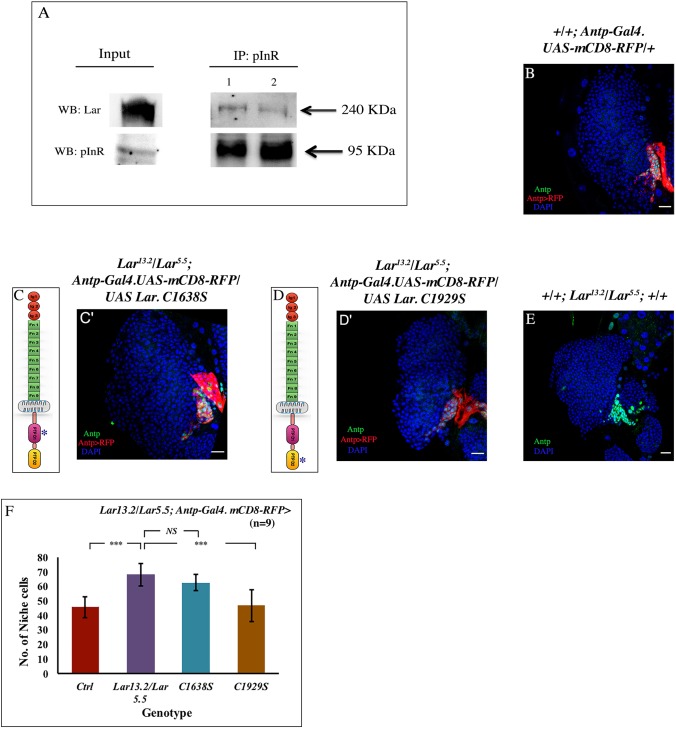
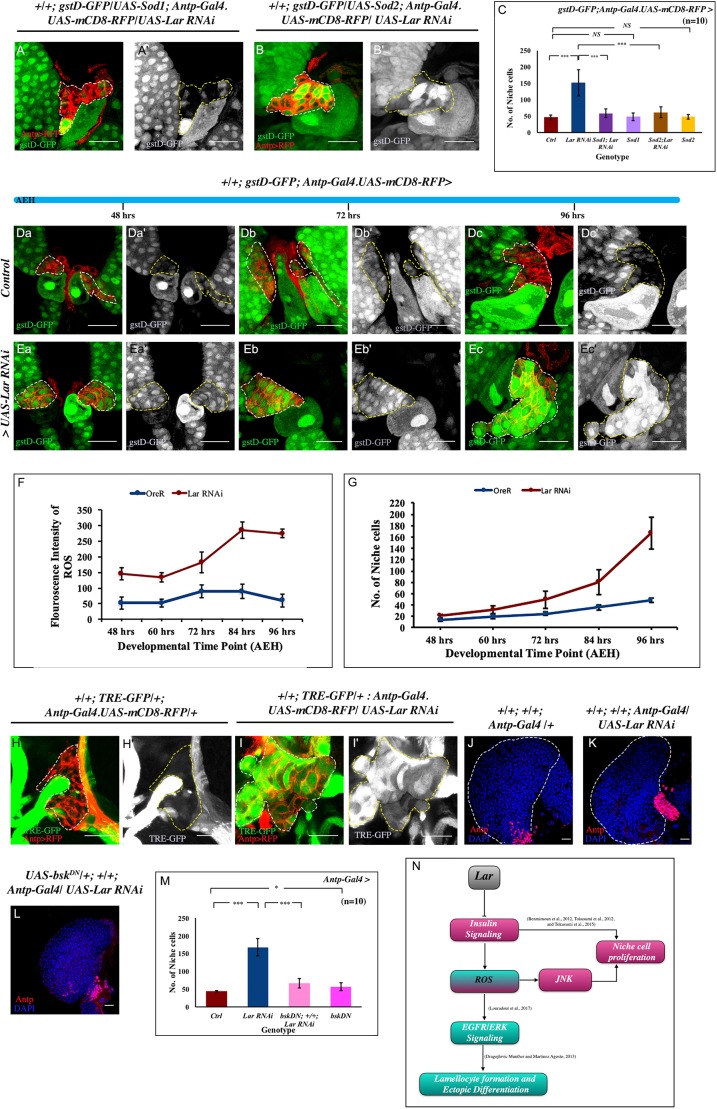
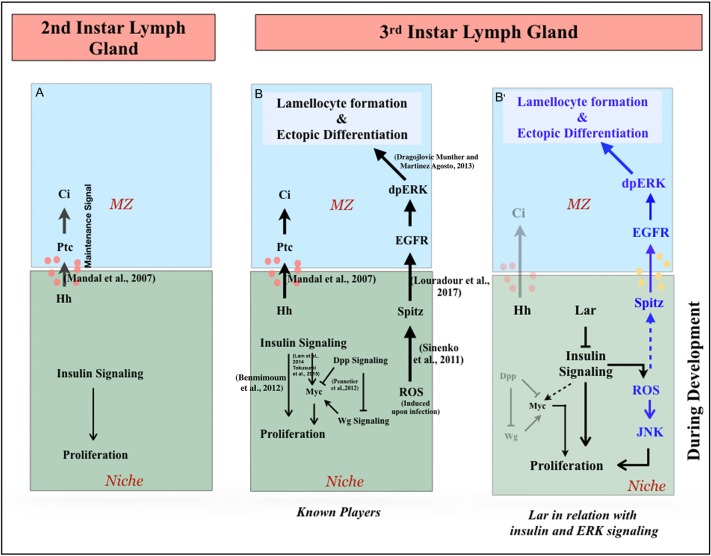
Stem cell compartments in metazoa get regulated by systemic factors as well as local stem cell niche-derived factors. However, the mechanisms by which systemic signals integrate with local factors in maintaining tissue homeostasis remain unclear. Employing the Drosophila lymph gland, which harbors differentiated blood cells, and stem-like progenitor cells and their niche, we demonstrate how a systemic signal interacts and harmonizes with local factor/s to achieve cell type-specific tissue homeostasis. Our genetic analyses uncovered a novel function of Lar, a receptor protein tyrosine phosphatase. Niche-specific loss of Lar leads to upregulated insulin signaling, causing increased niche cell proliferation and ectopic progenitor differentiation. Insulin signaling assayed by PI3K activation is downregulated after the second instar larval stage, a time point that coincides with the appearance of Lar in the hematopoietic niche. We further demonstrate that Lar physically associates with InR and serves as a negative regulator for insulin signaling in the Drosophila larval hematopoietic niche. Whether Lar serves as a localized invariable negative regulator of systemic signals such as insulin in other stem cell niches remains to be explored.

Keywords: Drosophila; Hematopoietic niche; InR-Pi3K-Akt signaling; Lar; Systemic signal.


Conflict of interest statement

Competing interestsThe authors declare no competing or financial interests.

Figures

Fig. 1.
Fig. 1.
Lar plays a vital role in hematopoietic niche maintenance. (A) A third instar lymph gland showing the cortical zone (CZ, red and violet), the medullary zone (MZ, blue) and the hematopoietic niche (PSC, green). The shaded purple line indicates the dorsal vessel. (A′) Schematic showing the strategy employed for the hematopoietic niche genetic screening. (A″) Info-graph denoting the regime of the experiments. (B-C′) Downregulation of Lar using Antp-Gal4.UAS-GFP resulted in increase in the niche cell number (Antp, magenta) (C,C′) compared with control (B,B′). (D) Three- to fourfold increase in niche cell number upon Lar downregulation (n=10, P=3.429×10⁻¹⁰, two-tailed unpaired Student's t-test). (E-F′) The number of hemocyte progenitors [red, E-cadherin (Shg)] in the wild type (WT) (E,E′) decreases when Lar is downregulated from the niche (F,F′). (G-J) Lar downregulation from the niche resulted in an increase of the differentiated population in the lymph gland: plasmatocytes (red, P1; compare I with G) and lamellocytes (red, L1; compare H with J). (K) Quantification of P1-positive cells seen in G and I (n=10; P=1.230×10⁻⁷; two-tailed unpaired Student's t-test). White dashed lines mark the lymph gland, yellow dashed lines mark the progenitor zone. The genotype of the larvae is described in the panels. Data are mean±s.d. ***P<0.0005. Scale bars: 20 µm.
Fig. 2.
Fig. 2.
Loss of Lar from niche causes hyperactivated insulin signaling. (A) Schematic of lymph gland highlighting region of interest, the niche, which has been magnified in panels B-C′,H′,H″,I′-M′. (B-C′) The membranous:cytoplasmic ratio of tGPH (Pi3K92E reporter, green) was higher in Lar knockdown from the niche (C,C′) compared with the wild-type (WT) niche (B,B′). (D) Quantification of membranous:cytoplasmic ratio of tGPH seen in B-C′ (number of cells subjected to intensity analyses=20; P=8.724×10⁻⁸; two-tailed unpaired Student's t-test). (E) Downregulation of InR from the hematopoietic niche resulted in a decrease in the niche cell number. (F) Activated insulin led to an increase in the niche cell number. (G) Statistical analysis of the niche cell number for WT, InR knockdown and insulin active from the hematopoietic niche (n=10; P=1.176×10⁻⁷ for WT versus InR RNAi, P=1.360×10⁻⁶ for WT versus UAS InRR418P; two-tailed unpaired Student's t-test). (H-I″) Low levels of phosphorylated Akt (pAKT; red, gray) expression are seen in the WT niche (H-H″), compared with an accumulation of pAkt following loss of Lar from the hematopoietic niche (green) (I-I″). (J-K′) A basal level of p4EBP is present in WT niche (J,J′), whereas Lar downregulation resulted in elevated p4EBP levels within the niche (K,K′). (L-M′) Rescue of both pAkt and p4EBP expression in a double knockdown of InR and Lar from the niche. (N) Statistical analysis reveals elevated pAkt expression in Lar knockdown PSC (n=50; P=2.996×10⁻⁵; two-tailed unpaired Student's t-test) which was restored in double knockdown of InR and Lar (n=50; P=1.936×10⁻⁵ for Lar RNAi; InR RNAi versus Lar RNAi; two-tailed unpaired Student's t-test). (O) Quantitative analysis revealed more p4EBP-positive cells in the Lar-downregulated niche (n=50; P=0.008; two-tailed unpaired Student's t-test), whereas following double knockdown of InR and Lar, hyperactivated insulin signaling visualized using p4EBP is restored (n=50; P=0.032 for Lar RNAi; InR RNAi versus Lar RNAi; two-tailed unpaired Student's t-test). (P-R″) An increase in niche cell numbers observed upon loss of Lar from the niche (Q-Q″) is reverted to WT levels (P-P″) in a simultaneous knockdown of both InR and Lar from the niche (R-R″). (S) Statistical analysis of the data in P-R″ (n=10; P=1.995×10⁻⁸ for WT versus Lar RNAi, P=3.244×10⁻⁹ for Lar RNAi; InR RNAi versus Lar RNAi; two-tailed unpaired Student's t-test). White dashed lines in B,C,H′,I′,J,K,L,M and yellow dashed lines in B′,C′,H″,I″,J′,K′,L′,M′ outline the niche. White dashed lines in E,F,H,R mark the boundary of the lymph gland. The genotype of the larvae is described in the panels. Data are mean±s.d. *P<0.05, **P<0.005 and ***P<0.0005. Scale bars: 20 µm.
Fig. 3.
Fig. 3.
Lar physically and genetically interacts with InR. (A) pInR, immunoprecipitated from third instar larval lysate, shows an association with Lar, demonstrating a physical interaction between InR and Lar. (B-E) No rescue of niche cell number occurred upon overexpressing mutated PTPD1 (C1638S) domain in a Lar13.2/Lar5.5 background (C,C′), when compared with Lar13.2/Lar5.5 (E), whereas overexpressing mutated PTPD2 (C1929S) domain in Lar13.2/Lar5.5 (D,D′) resulted in a niche cell number (Antp, green) that was comparable with the control (B). (C,D) Schematic representation of the Lar protein (an RPTP), which has three Ig (immunoglobulin) domains (red circles), nine Fn-III (fibronectin type III) domains (green) and a transmembrane domain (gray); the pink indicates the PTP D1 (catalytic) domain and the yellow is the PTPD2 domain. The constructs used are mutated at PTPD1 (C1638S) and PTPD2 (C1929S) domains (denoted by an asterisk), respectively. (F) Quantification of the niche cell number in the above genotypes (n=9, P=8.458×10⁻⁶ for WT versus Lar13.2/Lar5.5, P=0.103 for Lar13.2/Lar5.5 versus UAS C1638S, P=0.0003 for Lar13.2/Lar5.5 versus UAS C1929S; two-tailed unpaired Student's t-test). The genotype of the larvae is described in the panels. The niche is marked with Antp antibody (green) in B,C′,D′,E and red represents Antp-Gal4.UASmcD8 RFP in B,C′,D′. Data are mean±s.d. ***P<0.0005. NS, not significant. Scale bars: 20 µm.
Fig. 4.
Fig. 4.
Hyperactivated insulin leads to upregulated ROS levels in the hematopoietic niche causing ectopic differentiation via the EGFR/ERK pathway. (A) Schematic of lymph gland highlighting region of interest, the niche, which has been magnified in panels B-C′,O,O′,Q,Q′. (B-C′) ROS levels (gstD-GFP, green) increase following Lar knockdown (C,C′) compared with control (B,B′). (D) Quantification shows an eightfold increase of mean fluorescence intensity in gstD-GFP in Lar knockdown niches (n=50; P=6.866×10⁻⁵; two-tailed unpaired Student's t-test). (E,E′) At 72 h AEH, a basal level of dpERK (red) expression can be detected in the control MZ. (F,F′) Lar downregulation from the niche led to a robust increase in dpERK. (G) Quantification shows a twofold increase of dpERK in progenitors following Lar downregulation from the niche (n=50; P=4.932×10⁻⁵; two-tailed unpaired Student's t-test). (H-J) Loss of Lar from the niche generated lamellocytes (β-PS, green; I), not seen in the control (H); however, scavenging ROS in the background of Lar knockdown (J) suppressed lamellocyte formation. (K-N) The plasmatocyte population (P1) increased upon Lar downregulation from the niche (L) compared with the control (K). Niche-specific overexpression of Sod1 alone does not affect differentiation (M), whereas scavenging ROS by Sod1 upon Lar downregulation rescues the plasmatocyte population (N). (O-P) Downregulating Pten led to high ROS and lamellocyte generation. (Q-R) Double knockdown of Lar and InR from the niche rescued the high ROS level and ectopic lamellocyte formation. (S) Quantification shows a significant increase in ROS intensity following Pten and Tsc1 knockdown from the niche, whereas a rescue is observed in double knockdown of InR and Lar (n= 50; P=8.021×10⁻⁵ for WT versus Pten RNAi, P=0.0004 for WT versus Tsc1 RNAi, P=7.294×10⁻⁶ for WT versus InR RNAi; Lar RNAi, P=0.235 for WT versus InR RNAi; two-tailed unpaired Student's t-test). (T) Scheme based on our study: hyperactivated insulin signaling resulted in upregulated ROS in the niche, which responded in a manner similar to the immune response. The aberrant ERK activation resulted in ectopic differentiation along with lamellocyte production. White dashed lines in B,C,O,Q and yellow lines in B′,C′,O′,Q′ outline the niche. White dashed lines in H-N,P,R mark the boundary of the lymph gland. Yellow dashed lines in K-N mark the progenitor zone. The genotype of the larvae is described in the panels. Data are mean±s.d. ***P<0.0005. Scale bars: 20 µm.
Fig. 5.
Fig. 5.
Gradual increase in ROS over time is associated with increased niche cell proliferation. (A-B′) Scavenging ROS by overexpressing both Sod1 and Sod2 in conjunction with loss of Lar from the niche resulted in rescue in both ROS (gstD-GFP, green) and a partial rescue in niche cell number (Antp-Gal4.UAS-RFP, red). (C) Quantification of niche cell number in A-B′ (n=10; P=1.321×10⁻⁵ for WT versus Lar RNAi, P=2.493×10⁻⁵ for Lar RNAi versus UAS Sod1; Lar RNAi, P=0.708 for WT versus UAS Sod1, P=2.952×10⁻⁵ for Lar RNAi versus UAS Sod2; Lar RNAi, P=0.551 for WT versus UAS Sod2; two-tailed unpaired Student's t-test). (Da- Ec′) Temporal analysis for ROS was carried out both in control and in Lar loss from the niche. In the developmental timeline from 48 h to 96 h AEH, a basal level of ROS was detected in the wild-type (WT) niche (Da-Dc′). A gradual accumulation of ROS, which maximized after 72 h AEH, was seen upon Lar abrogation from the niche (Ea-Ec′). (F,G) Graphical representation of ROS (F) and niche cell number (G) in control and experiment. (H-I′) Upregulation of JNK signaling visualized by its reporter TRE-GFP in Lar knockdown (I,I′) compared with WT niche (H,H′). (J-L) Increased niche number (Antp, red) observed on Lar loss from the niche (K), compared with control (J), is partially rescued by downregulating JNK (bskDN) in conjunction with Lar downregulation (L). (M) Quantification of J-L and Fig. S5F (n=10; P=9.474×10⁻⁶ for WT versus Lar RNAi, P=3.249×10⁻⁶ for Lar RNAi versus bskDN; +; Lar RNAi, P=0.019 for WT versus bskDN; two-tailed unpaired Student's t-test). (N) Lar regulates insulin signaling, thereby controlling niche cell number. The absence of Lar function leads to increased insulin signaling, resulting in upregulated ROS that contributes to cell proliferation by JNK activation. White dashed lines in A,B,Da,Db,Dc,Ea,Eb,Ec,H,I and yellow dashed lines in A′,B′,Da′,Db′,Dc′,Ea′,Eb′,Ec′,H′,I′ outline the niche. White dashed lines in J,K mark the boundary of the lymph gland. The genotype of the larvae is described in the panels. Data are mean±s.d. *P<0.05, ***P<0.0005. NS, not significant. Scale bars: 20 µm.
Fig. 6.
Fig. 6.
Lar and insulin have an antagonistic relationship with each other. (A) Expression of Lar in third instar lymph gland visualized by Lar antibody (red). (A′-A″) Magnification of boxed area in A representing the niche: a robust Lar expression (red) can be detected in the hematopoietic niche (green). (B-B″) At 36 h AEH, Lar expression level was hardly detectable in the niche. (C-C″) Lar expression was detectable by 48 h AEH. (D-D″) Robust Lar expression was seen in the niche at 96 h AEH. (E-Eb″) Co-immunostaining of Lar and insulin reporter (tGPH) indicated their antagonistic relationship. At 60 h AEH, Lar expression was enriched in the niche. (Ea-Ea″) Magnified area 1 of E reveals that regions with high tGPH (green) expression were coupled with low Lar (magenta) expression. (Eb-Eb″) Magnified area 2 of E represents the niche with low tGPH (green) but high Lar (magenta) expression. Arrow 1 indicates peripheral hemocytes of the lymph gland; arrow 2 indicates the niche. (F) Schematic based on our expression analysis proposing the antagonistic relationship of insulin and Lar. The peach bar is the dorsal vessel, and pale green pink-outlined cells are the inner core cells of the lymph gland, which are low in membranous tGPH but high in Lar expression. In the niche, the highest level of Lar expression is seen with a concomitant decrease in the membranous tGPH expression. (G-J′) Micrograph (left) and schematic (right) showing the effect of insulin signaling on niche cell proliferation. (G-H′) Niche cell number declined upon blocking insulin signaling by removal of ligand through starvation (H,H′) as compared with control (G,G′). (I-J′) On starvation (J-J′), the increased niche cell number (red, Antp) seen upon Lar loss (I-I′) reverted to control. (K) Statistical analysis of niche cell number in G-J′. White dashed lines outline the niche. The genotype of the larvae is described in the panels. Data are mean±s.d. *P<0.05, ***P<0.0005. Scale bars: 20 µm.
Fig. 7.
Fig. 7.
Representation of the role of Lar in the niche to maintain lymph gland homeostasis. (A) In the early instar lymph gland, absence of Lar in the niche ensures insulin signaling-mediated proliferation. (B) Known players: insulin signaling and Dpp-Wg signaling activate the Myc (Dmyc) circuit relevant for niche cell proliferation and niche function. The signaling pathway is upregulated as a result of the niche-mediated immune response during wasp infection. (B′) Post second instar, the appearance and subsequent increase in Lar expression curtails insulin signaling to restrict proliferation. Thus, the increase in insulin signaling due to Lar downregulation led to proliferation in the niche cell number along with an accumulation of ROS. The high levels of ROS in the niche ectopically induce JNK, bolstering the proliferation. High ROS also feeds into the known pathway that is activated only during infection. Here, Spitz from the niche upregulates phosphorylated ERK in MZ, which results in ectopic differentiation along with lamellocyte production. Loss of Lar engages this pathway developmentally in the absence of infection.

Similar articles

Cited by

References

    1. Ahmad F., Considine R. V. and Goldstein B. J. (1995). Increased abundance of the receptor-type protein-tyrosine phosphatase LAR accounts for the elevated insulin receptor dephosphorylating activity in adipose tissue of obese human subjects. J. Clin. Invest. 95, 2806-2812. 10.1172/JCI117985 - DOI - PMC - PubMed
    1. Ahmad F. and Goldstein B. J. (1997). Functional association between the insulin receptor and the transmembrane protein-tyrosine phosphatase LAR in intact cells. J. Biol. Chem. 272, 448-457. 10.1074/jbc.272.1.448 - DOI - PubMed
    1. Asha H., Nagy I., Kovacs G., Stetson D., Ando I. and Dearolf C. R. (2003). Analysis of Ras-induced overproliferation in Drosophila hemocytes. Genetics 163, 203-215. - PMC - PubMed
    1. Baldeosingh R., Gao H., Wu X. and Fossett N. (2018). Hedgehog signaling from the posterior signaling center maintains U-shaped expression and a prohemocyte population in Drosophila. Dev. Biol. 441, 132-145. 10.1016/j.ydbio.2018.06.020 - DOI - PMC - PubMed
    1. Banerjee U., Girard J. R., Goins L. M. and Spratford C. M. (2019). Drosophila as a genetic model for hematopoiesis. Genetics 211, 367-417. 10.1534/genetics.118.300223 - DOI - PMC - PubMed

Publication types

MeSH terms