

Bridging the gap between efficacy trials and model-based impact evaluation for new tuberculosis vaccines
- PMID: 31784512
- PMCID: PMC6884451
- DOI: 10.1038/s41467-019-13387-9
Bridging the gap between efficacy trials and model-based impact evaluation for new tuberculosis vaccines
Abstract
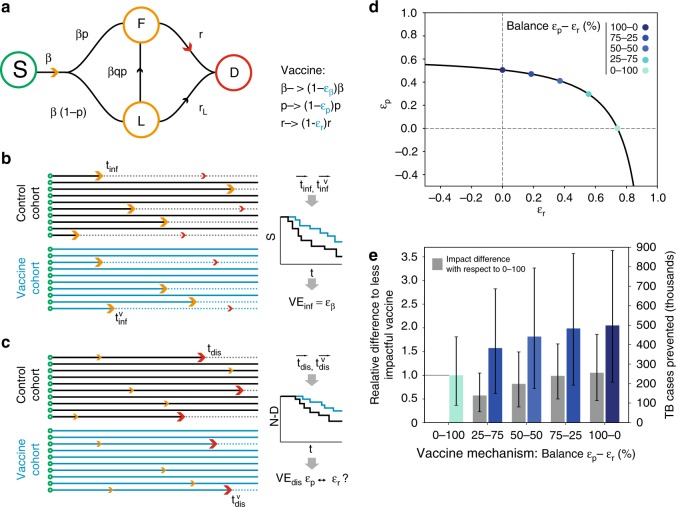
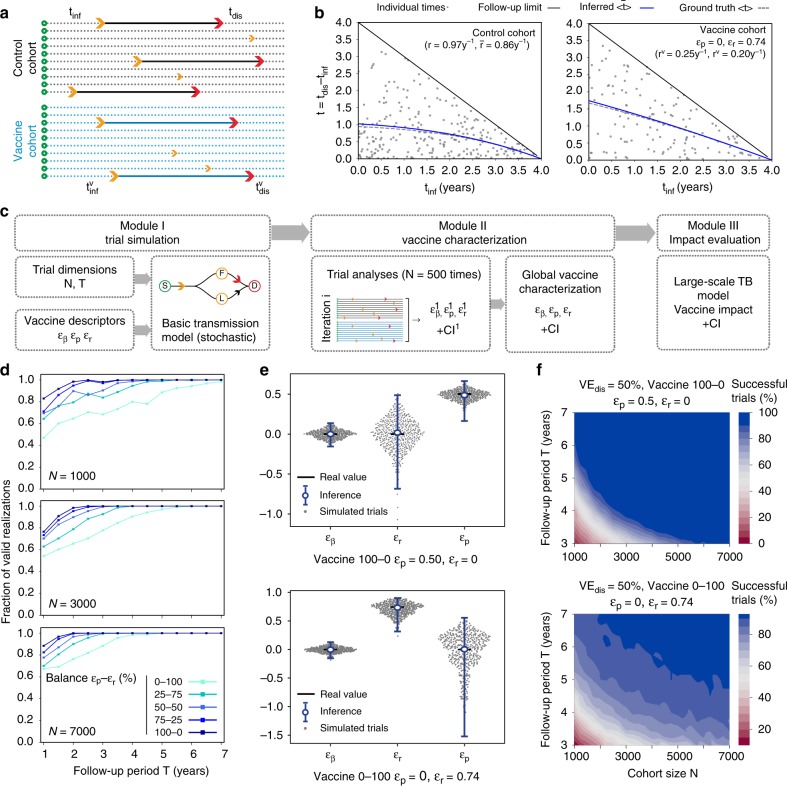
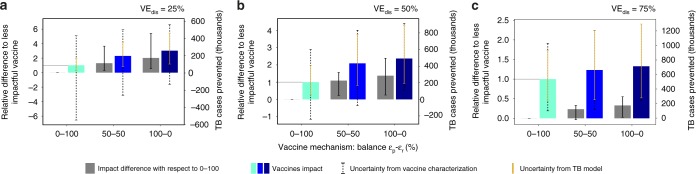
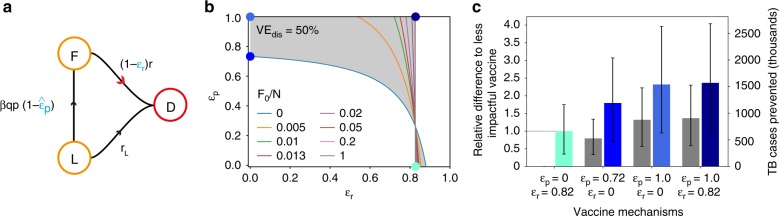
In Tuberculosis (TB), given the complexity of its transmission dynamics, observations of reduced epidemiological risk associated with preventive interventions can be difficult to translate into mechanistic interpretations. Specifically, in clinical trials of vaccine efficacy, a readout of protection against TB disease can be mapped to multiple dynamical mechanisms, an issue that has been overlooked so far. Here, we describe this limitation and its effect on model-based evaluations of vaccine impact. Furthermore, we propose a methodology to analyze efficacy trials that circumvents it, leveraging a combination of compartmental models and stochastic simulations. Using our approach, we can disentangle the different possible mechanisms of action underlying vaccine protection effects against TB, conditioned to trial design, size, and duration. Our results unlock a deeper interpretation of the data emanating from efficacy trials of TB vaccines, which renders them more interpretable in terms of transmission models and translates into explicit recommendations for vaccine developers.
Conflict of interest statement
C.M. is a co-inventor on a composition of matter patent: Title: Tuberculosis Vaccine. Owner entity: Universidad de Zaragoza, Request number: PCT/ES 2007/070051. All other authors declare no competing interests.
Figures
Similar articles
-
Addressing mechanism bias in model-based impact forecasts of new tuberculosis vaccines.Nat Commun. 2023 Sep 1;14(1):5312. doi: 10.1038/s41467-023-40976-6. Nat Commun. 2023. PMID: 37658078 Free PMC article.
-
Innovative clinical trial designs to rationalize TB vaccine development.Tuberculosis (Edinb). 2015 May;95(3):352-7. doi: 10.1016/j.tube.2015.02.036. Epub 2015 Mar 6. Tuberculosis (Edinb). 2015. PMID: 25802031 Review.
-
Age-targeted tuberculosis vaccination in China and implications for vaccine development: a modelling study.Lancet Glob Health. 2019 Feb;7(2):e209-e218. doi: 10.1016/S2214-109X(18)30452-2. Epub 2019 Jan 7. Lancet Glob Health. 2019. PMID: 30630775
-
Multi-stage subunit vaccines against Mycobacterium tuberculosis: an alternative to the BCG vaccine or a BCG-prime boost?Expert Rev Vaccines. 2018 Jan;17(1):31-44. doi: 10.1080/14760584.2018.1406309. Epub 2017 Nov 22. Expert Rev Vaccines. 2018. PMID: 29148853 Review.
-
The Systematic Review and Meta-Analysis on the Immunogenicity and Safety of the Tuberculosis Subunit Vaccines M72/AS01E and MVA85A.Front Immunol. 2020 Oct 8;11:1806. doi: 10.3389/fimmu.2020.01806. eCollection 2020. Front Immunol. 2020. PMID: 33133057 Free PMC article.
Cited by
-
Addressing mechanism bias in model-based impact forecasts of new tuberculosis vaccines.Nat Commun. 2023 Sep 1;14(1):5312. doi: 10.1038/s41467-023-40976-6. Nat Commun. 2023. PMID: 37658078 Free PMC article.
-
Model-based impact evaluation of new tuberculosis vaccines in aging populations under different modeling scenarios: the case of China.Front Public Health. 2024 Feb 23;12:1302688. doi: 10.3389/fpubh.2024.1302688. eCollection 2024. Front Public Health. 2024. PMID: 38463158 Free PMC article.
-
BCG vaccination strategies against tuberculosis: updates and perspectives.Hum Vaccin Immunother. 2021 Dec 2;17(12):5284-5295. doi: 10.1080/21645515.2021.2007711. Epub 2021 Dec 2. Hum Vaccin Immunother. 2021. PMID: 34856853 Free PMC article. Review.
References
-
- WHO. Global Tuberculosis Report 2019 (World Health Organization, 2019).
-
- Silva CJ, Torres DFM. A TB-HIV/AIDS coinfection model and optimal control treatment. Discret. Contin. Dyn. S. 2015;35:4639–4663. doi: 10.3934/dcds.2015.35.4639. - DOI
Publication types
MeSH terms
Substances
LinkOut - more resources
Full Text Sources
Medical
Miscellaneous
