. 2019 Nov 29;10(1):5448.
doi: 10.1038/s41467-019-13224-z.

SIPA1L2 controls trafficking and local signaling of TrkB-containing amphisomes at presynaptic terminals

Affiliations

SIPA1L2 controls trafficking and local signaling of TrkB-containing amphisomes at presynaptic terminals

Maria Andres-Alonso et al. Nat Commun. .

Abstract

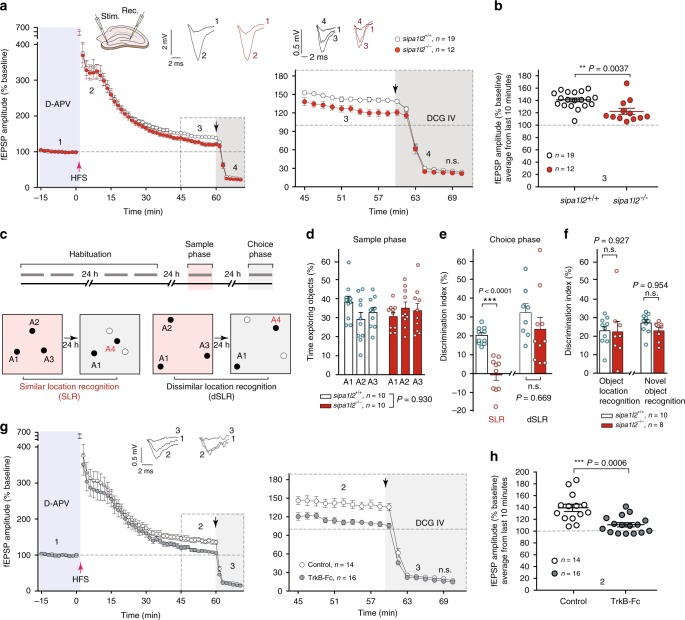
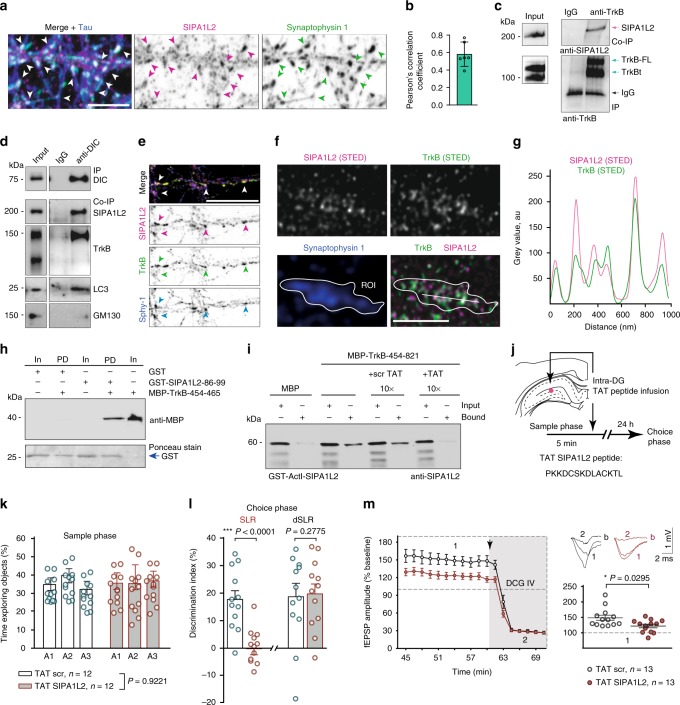
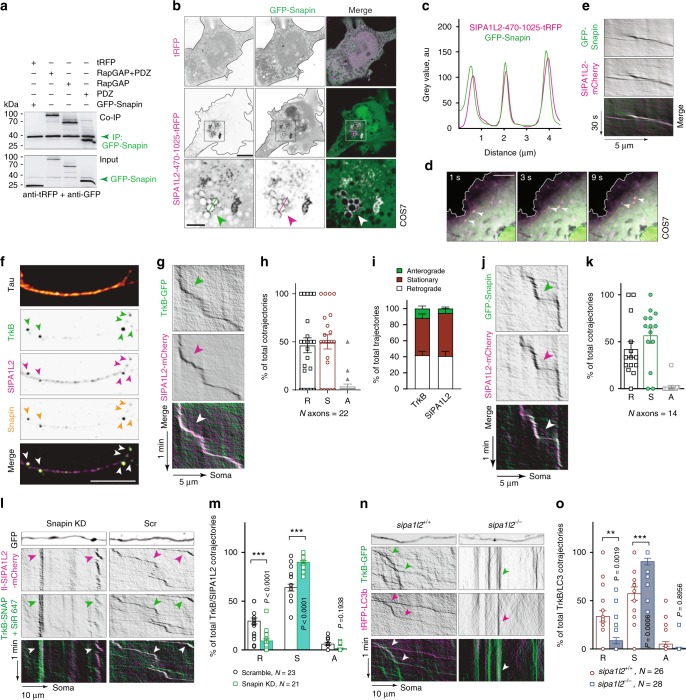
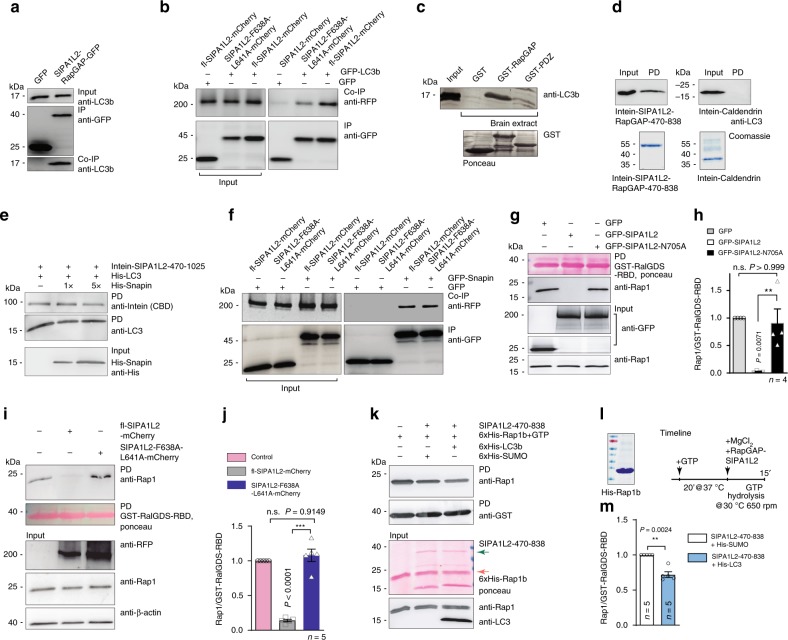
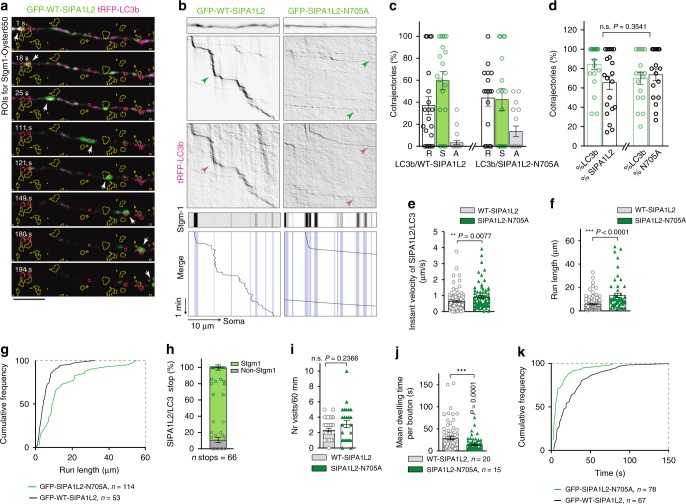
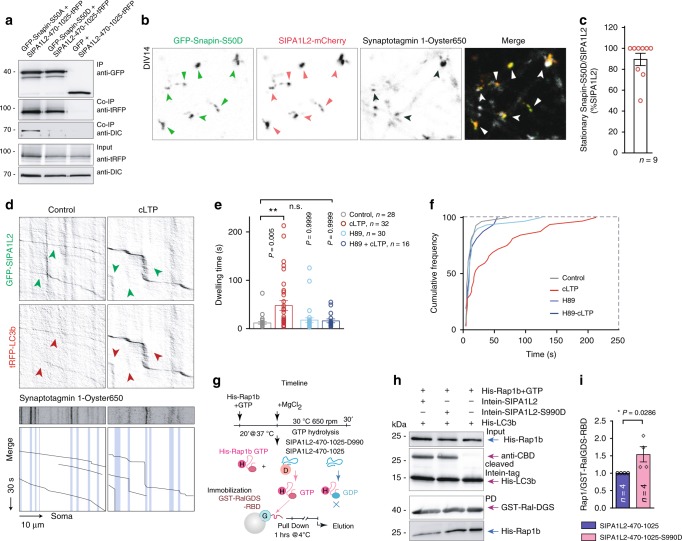
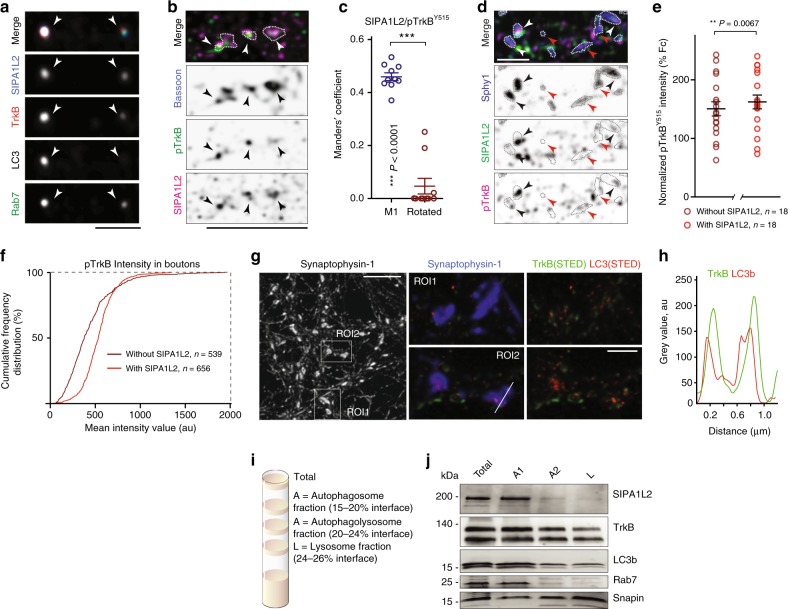
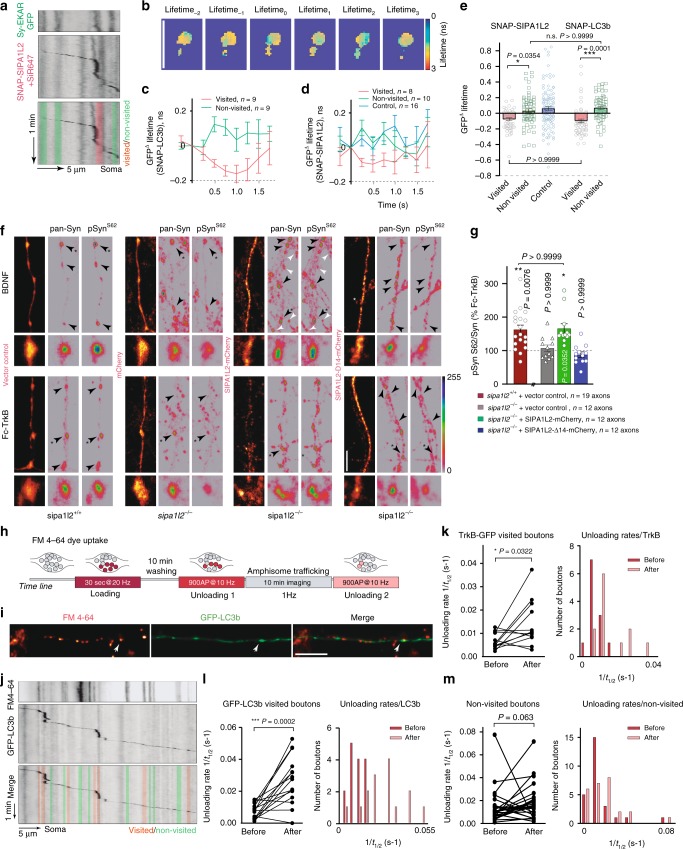
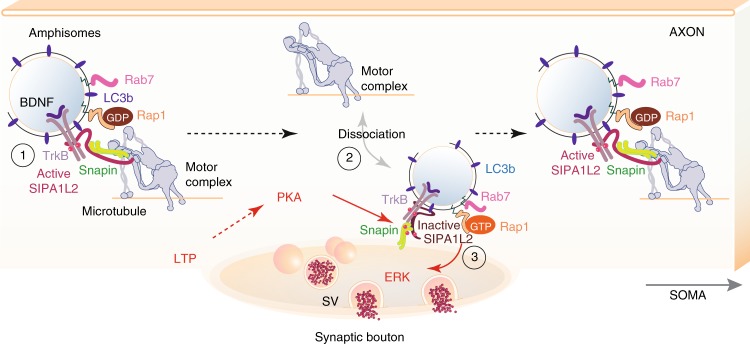
Amphisomes are organelles of the autophagy pathway that result from the fusion of autophagosomes with late endosomes. While biogenesis of autophagosomes and late endosomes occurs continuously at axon terminals, non-degradative roles of autophagy at boutons are barely described. Here, we show that in neurons BDNF/TrkB traffick in amphisomes that signal locally at presynaptic boutons during retrograde transport to the soma. This is orchestrated by the Rap GTPase-activating (RapGAP) protein SIPA1L2, which connects TrkB amphisomes to a dynein motor. The autophagosomal protein LC3 regulates RapGAP activity of SIPA1L2 and controls retrograde trafficking and local signaling of TrkB. Following induction of presynaptic plasticity, amphisomes dissociate from dynein at boutons enabling local signaling and promoting transmitter release. Accordingly, sipa1l2 knockout mice show impaired BDNF-dependent presynaptic plasticity. Taken together, the data suggest that in hippocampal neurons, TrkB-signaling endosomes are in fact amphisomes that during retrograde transport have local signaling capacity in the context of presynaptic plasticity.


Conflict of interest statement

The authors declare no competing interests.

Figures

Fig. 1
Fig. 1
sipa1l2−/− mice exhibit impaired MF plasticity and deficits in pattern separation. a MF-LTP was induced in acute slices using a high-frequency stimulus (HFS) protocol. The NMDA receptor antagonist D-APV (50 μM) was present during baseline recordings and LTP induction (shaded blue). Bath application of the group II mGluR agonist DCG-IV (2 μM) that suppresses synaptic transmission at the MF pathway was performed during the last 10 min (shaded gray) of each experiment to control input specificity. Left, the average values of fEPSP amplitudes upon MF-LTP induction. Right, fEPSP amplitudes during the last 45–70 min following MF-LTP induction. b Averaged fEPSP amplitudes recorded during the last 10 min of a before DCG-IV application (Mann-Whitney U test). c Timeline (upper panel) and schematic representation of the object distribution (lower panel) of the spatial pattern separation test. Gray bars indicate 10-min intervals. During the sample phase (red-shaded) objects (A1–3) in the similar location recognition group (SLR) were placed closer while objects in the dissimilar location recognition group (dSLR) (A1–3) were placed farther away from each other. During choice phase (gray-shaded), a new object (A4) was introduced. Animals from the SLR find A4 closer to positions A2–A3 and have a higher demand for pattern separation than those from the dSLR. Filled circles (A1–4) represent object location. Open circles indicate the absence of objects. d Exploration time of sipa1l2 wt and ko animals in A1–3 during the sample phase (two-way ANOVA). e Discrimination index during choice phase in the SLR and dSLR groups (unpaired Student’s t test). f Discrimination index of sipa1l2 wt and ko animals during the novel object location recognition and object recognition test (unpaired Student’s t test). g, h Left, average fEPSP amplitudes upon MF-LTP induction performed as explained in a in control and BDNF-depleted slices (TrkB-Fc, 5 µg/mL). Right, a close-up representation from the last 45–70 min. In h, averaged fEPSP amplitudes obtained during the last 10 min of g prior DCG-IV application (Mann-Whitney U test). Bars and error bars depict mean ± SEM in all graphs. Circles represent mean values from individual subjects (df) or slices (a, b, g, h). n.s. not significant. "**" indicates P ≤ 0.01; "***" indicates P ≤ 0.001.
Fig. 2
Fig. 2
SIPA1L2/TrkB interaction at presynapses is crucial for the function of the DG. a Confocal images of rat hippocampal neurons immunostained against SIPA1L2, Synaptophysin 1 and Tau. Scale bar is 5 μm. b Pearson’s correlation coefficient calculated for SIPA1L2 and Synaptophysin 1 from a. Circles represent averaged values per region of interest (ROI) analyzed from three independent images. c Endogenous TrkB coimmunoprecipitates SIPA1L2 from rat hippocampal lysates. The two bands in TrkB correspond to the full length (TrkB-FL) and the truncated form (TrkBt). Goat anti-TrkB antibody (R&D) is used for precipitation and detection. d DIC coimmunoprecipitates SIPA1L2 and TrkB but not GM130 from mouse whole brain crude light membrane fraction. Note that the band revealing TrkB corresponds to the full-length form. e Confocal images from rat hippocampal neurons immunostained against SIPA1L2, TrkB and Synaptophysin 1 (Sphy1). Scale bar is 10 μm. f STED images from hippocampal neurons immunostained against SIPA1L2, TrkB and Synaptophysin 1 (confocal). Line profiles (g) indicate relative intensities for STED channels along 1 µm. Scale bar is 1 µm. h Pull-down assay between the juxtamembrane region of TrkB and the 14aa of the binding interface in ActI-SIPA1L2. i Pull-down assay between TrkB and ActI-SIPA1L2 in the presence of 10× TAT binding peptide (TAT) or 10× scrambled peptide (TAT-scr). j Cartoon representing the timeline used for the pattern separation test performed in wt animals infused with TAT peptides and the location of the infusion (red dot). k Exploring time from mice injected with TAT-SIPA1L2 or TAT-scr during the sample phase (two-way ANOVA). l Discrimination indexes obtained during the choice phase in SLR and dSLR groups injected with either TAT-SIPA1L2 or TAT-scr. The number of subjects is depicted in k (unpaired Student’s t test). m fEPSP amplitudes recorded during the last 45–70 min after MF-LTP upon bath perfusion of TAT-SIPA1L2 or TAT-scr peptides. Right, averaged values of fEPSP amplitudes during last 10 min of LTP recording before DCG IV application (Mann-Whitney U test). Bars and error bars represent data as mean ± SEM in all graphs. Circles represent mean values of individual subjects (kl) or slices (m). "*" indicates P ≤ 0.05; "***" indicates P ≤ 0.001.
Fig. 3
Fig. 3
SIPA1L2 associates and cotrafficks with Snapin and TrkB. a GFP-Snapin coimmunoprecipitates RapGAP- and PDZ-SIPA1L2-tRFP from HEK293T cells extracts. The upper blot shows the signal from the anti-tagRFP and anti-GFP antibodies. Green arrow indicates immunoprecipitated GFP-Snapin. The lower blot represents the input. Note that the anti-tRFP antibody used also recognizes GFP. b, c Representative images (b) from the recruitment assay performed in COS7 cells using SIPA1L2-470-1025-tRFP or tRFP as control and GFP-Snapin. Insets are shown in the lower panel. The line profile (c) was generated from the line in the inset. d, e Snap-shots of fl-SIPA1L2-mCherry and GFP-Snapin cotrafficking in COS7 cells (d) and corresponding kymograph (e). Orange line in d represents the trajectory used for kymograph generation (e). f Confocal images from rat hippocampal neurons stained against TrkB, SIPA1L2, Snapin, and Tau. g, h Representative kymographs from neurons overexpressing TrkB-GFP and fl-SIPA1L2-mCherry. Relative motility of SIPA1L2/TrkB cotrajectories is indicated in h. Total number of cotrajectories is 84. i Relative motility of TrkB and SIPA1L2 as a percentage of total trajectories (TrkB = 284 trajectories; SIPA1L2 = 146; the number of axons is depicted in h). j, k Representative kymographs from neurons overexpressing GFP-Snapin and fl-SIPA1L2-mCherry. Relative motility of SIPA1L2/Snapin cotrajectories is represented in k. Total number of cotrajectories is 60. l, m Representative kymographs from neurons overexpressing either shRNA-based Snapin KD or Scr control together with fl-SIPA1L2-mCherry and TrkB-SNAP (+SiR647). GFP represents transfection control. Relative motility of SIPA1L2/TrkB cotrajectories is depicted in m. N = analyzed axons (nonparametric Kolmogorov-Smirnov test). n, o Representative kymographs and quantification of a percentage of TrkB-GFP/tRFP-LC3b cotrajectories in sipa1l2−/− as compared to sipa1l2+/+ mouse hippocampal neurons. (nonparametric Kolmogorov-Smirnov test; N number corresponds to axons). Representative kymographs (g, j, l, n) were generated from axons of rat hippocampal neurons. Relative motility (h, k, m, o) is shown as percentage of total cotrajectories. Bars and error bars represent data as mean ± SEM. N number in the graph corresponds to the number of axons. Symbols in columns represent values from single axons. Arrows indicate cotrajectories. R retrograde, S stationary, A anterograde. Scale bars are 10 μm (b) and 5 μm (b, inset; df). "**" indicates P ≤ 0.01; "***" indicates P ≤ 0.001.
Fig. 4
Fig. 4
LC3 interacts with the RapGAP domain of SIPA1L2 and promotes RapGAP activity. a RapGAP-GFP but not GFP immunoprecipitates endogenous LC3 from a HEK293T cell extract. b Heterologous Co-IP from HEK293T cells showing a reduced interaction between GFP-LC3b and SIPA1L2-F638A-L641A-mCherry, which harbors a mutation within the LIR motif (FxxL/AxxA), when compared to fl-SIPA1l2-mCherry. c GST-RapGAP but not GST-PDZ domain of SIPA1L2 pulled down endogenous LC3 from rat brain extracts. The Ponceau staining indicates protein loading. d Intein-RapGAP domain of SIPA1L2 (SIPA1L2-470-838) pulls down bacterially expressed His-LC3b. Intein-Caldendrin was used as a nonrelated control. Coomassie blue staining is shown below. e Pull-down assay performed in the presence of Snapin. Note that an excess (5×) of Snapin does not interfere with the binding of LC3b to the RapGAP domain (SIPA1L2-470-1025). Intein tag is detected using anti-CBD antibodies against the Chitin Binding Domain of Intein and is depicted as anti-Intein (CBD). f Both fl-SIPA1L2-mCherry and SIPA1L2-F638A-L641A-mCherry coimmunoprecipitates GFP-Snapin from HEK293T cell extracts. g, h RapGAP activity assay shows decreased pull-down of Rap1-GTP from HEK293T cell extracts in the presence of GFP-SIPA1L2 but not GFP-SIPA1L2-N705A. The bar graph in h shows the quantification of the Rap1/RalGDS-RBD ratio from four independent experiments (one-way ANOVA with Bonferroni’s correction). i, j SIPA1L2-mCherry but not SIPA1L2-F638A-L641A-mCherry reduces Rap1-GTP pull-down with GST-RalGDS-RBD when expressed in HEK293T cells. Quantification of the Rap1/GST-RalGDS-RBD ratio is shown in j (one-way ANOVA with Bonferroni’s correction). km Rap-GAP activity assay performed with recombinant SIPA1L2-470-838 in the presence of His-LC3b or His-SUMO as a negative control. In l, time line of the RapGAP activity assay and purity of His-Rap1b confirmed by SDS-PAGE and Coomassie  blue staining. In m, quantification of the Rap1-GST-RalGDS-RBD ratio shows the effect of LC3b on enhancing RapGAP activity of SIPA1L2 (paired Student’s t test). Bars and error bars represent data as mean ± SEM. N number in the graph corresponds to number of independent experiments. n.s. not significant. "**" indicates P ≤ 0.01; "***" indicates P ≤ 0.001.
Fig. 5
Fig. 5
The RapGAP activity of SIPA1L2 controls the motility of SIPA1L2-amphisomes. a Time-lapse representation of GFP-SIPA1L2/tRFP-LC3b visiting presynaptic boutons from rat primary hippocampal neurons live-labeled by Stgm-1Oyster650 (yellow ROIs). Note that only ROIs in red are within the axon of interest and considered for analysis. Imaging was performed in conditioned neuronal media and three-channel time-lapse acquired for 5 min. Scale bar = 5 μm. b Representative kymographs from the experiment described in a. Neurons expressed tRFP-LC3b and GFP-SIPA1L2 or GFP-SIPA1L2-N705A. Below, stationary Stgm-1Oyster650 indicates presynaptic boutons. Sketch drawing represents traces of cotrajectories aligned with positions of presynaptic boutons (shaded blue lines). c, d Relative motility of SIPA1L2/LC3b and SIPA1L2-N705A/LC3b cotrajectories as percentage of total cotrajectories shows predominantly retrograde (R) movement (S, stationary; A, anterograde). In d, cotrajectories showed as a percentage of total LC3b or SIPA1L2 trajectories. Circles in bar graphs show values per analyzed kymograph (GFP-SIPA1L2: n = 20 axons, GFP-SIPA1L2-N705A: n = 17 axons). One-way ANOVA with Bonferroni’s posthoc test. e Instant velocity (μm/s) of GFP-SIPA1L2/tRFP-LC3b and GFP-SIPA1L2-N705/tRFP-LC3b cotrajectories. GFP-SIPA1L2: n = 102 instant measures from 20 axons; GFP-SIPA1L2-N705A: n = 77 instant measures from 14 axons. Mann−Whitney U test for the number of instant measures. f, g Quantification (f) and cumulative distribution (g) of the run-length; GFP-SIPA1L2: n = 114 measures from 20 axons; GFP-SIPA1L2-N705A: n = 53 measures from 14 axons (Mann-Whitney U test for the number of measures). h Percentage of LC3b/SIPA1L2 stopovers occurring in presynaptic boutons labeled by a Synaptotagmin 1 (Stgm1) antibody shows the preferential occurrence of these stopovers at boutons. Stops occurring outside Stgm1 labeling are depicted as non-Stgm1. Numbers of stops from 13 axons is depicted under the graph. i Average number of visited boutons in 60 μm axon lengths of SIPA1L2/LC3b and SIPA1L2-N705A/LC3b vesicles. GFP-SIPA1L2: n vesicles = 21 from 20 axons; GFP-SIPA1L2-N705A: n vesicles = 21 from 14 axons cultures (Mann-Whitney U test for number of vesicles). j, k Mean synaptic dwelling time (GFP-SIPA1L2: n = 78 stops from 20 axons; GFP-SIPA1L2-N705A: n = 67 stops from 15 axons) calculated from imaging of neurons in conditioned neuronal media (Mann-Whitney U test for n of stops). Data in bar graphs are depicted as mean ± SEM. n.s. - not significant. "**" indicates P ≤ 0.01; "***" indicates P ≤ 0.001.
Fig. 6
Fig. 6
cLTP prolongs dwelling time of SIPA1L2-amphisomes at presynaptic boutons. a Heterologous coimmunoprecipitation experiments using SIPA1L2-470-1025-tRFP (RapGAP-PDZ) and a phospho-deficient (GFP-Snapin-S50A) or a phosphomimetic Snapin mutant (GFP-Snapin-S50D). Both forms of Snapin coimmunoprecipitates with SIPA1L2, but only the phospho-deficient form of Snapin coimmunoprecipitates with DIC. b, c Snapshots in b obtained from time-lapse imaging in rat hippocampal cells overexpressing GFP-Snapin-S50D together with fl-SIPA1L2-mCherry where mostly immobile (b, arrows) vesicles were found at presynaptic terminals labeled with anti-Synaptotagmin 1-Oyster650 (black arrows). Scale bar is 10 μm. In c quantification of the percentage of stationary cotrajectories (note the difference with Fig. 3k). df Kymographs generated from axons coexpressing GFP-SIPA1L2 and tRFP-LC3b and labeled in vivo with Stgm-1Oyster650 after control or chemical long-term potentiation (cLTP) induction. Imaging was performed in nonconditioned, extracellular imaging buffer. Below, merge images represent traces of cotrajectories aligned with positions of presynaptic boutons (shaded blue lines). Dwelling time of the SIPA1L2-LC3b-amphisomes at boutons is represented in e and corresponding cumulative distribution diagram in f. Data represented as mean ± SEM. N numbers in e, f correspond to vesicles analyzed from 11 axons (control), 14 axons (cLTP), 8 axons (H89) and 6 axons (H89 + cLTP) (one-way ANOVA on ranks with Dunn’s multiple comparison test for vesicles). gi In g, the timeline for the RapGAP activity assays performed in h, i. Recombinant intein-tagged SIPA1L2-470-1025 as well as SIPA1L2-470-1025-S990D (phosphomimetic SIPA1L2 mutant in a potential PKA phosphosite) were used to hydrolize recombinant Rap1b loaded with GTP in the presence of LC3b. Quantification of four independents experiments in i (Mann-Whitney U test). Bar graphs depict data as mean ± SEM. "*" indicates P ≤ 0.05; "***" indicates P ≤ 0.001.
Fig. 7
Fig. 7
TrkB-LC3b-Rab7-containing amphisomes are positive for SIPA1L2. a Confocal images of quadruple immunofluorescence performed in rat primary hippocampal neurons stained for SIPA1L2, LC3, TrkB with Rab7. Scale bar is 1 μm. b Confocal images of primary neurons treated with BDNF and stained for pTrkBY515, SIPA1L2, and Bassoon show colocalization of SIPA1L2 and pTrkB Y515 in presynaptic boutons. Scale bar is 5 µm. c Mander’s coefficient calculated for pTrkBY515 and SIPA1L2 in boutons detected by Bassoon staining. For control measurements, the same images were rotated 90º to the right (paired Student’s t test). d, e Representative images in d of rat hippocampal neurons treated with BDNF and stained for pTrkBY515, SIPA1L2 and Synaptophysin1. Arrows indicate boutons where SIPA1L2 is present (black) or absent (red). Note that in the presence of SIPA1L2, pTrkBY515 intensity is higher compared to those from boutons where SIPA1L2 is absent. Quantification is shown in e, circles represent averaged intensities per image (paired Student’s t test for average per image). Averaged intensities are normalized to images acquired from Fc-TrkB-treated neurons. The cumulative frequency distribution is shown in f (n = synaptic boutons). Scale bar is 2 μm. g, h Super-resolution STED imaging performed in rat hippocampal neurons revealed association of TrkB with LC3 at the presynaptic boutons. In h, line profiles from the line in the ROI2 in g. Scale bars 5 µm (overview) and 1 µm (inserts). i, j In i, scheme depicting fractionation protocol performed from rat brain that results in autophagosome (A1), autophagolysosome (A2) and lysosome (L) fraction. Note that Rab7 and SIPA1L2 are only present in the total and A1 fraction (j) according to their presence in amphisomes but not in later stages of the autophagosomal pathway. Lines in dot plot graphs depict data as mean ± SEM. "**" indicates P ≤ 0.01; "***" indicates P ≤ 0.001.
Fig. 8
Fig. 8
SIPA1L2-amphisomes activate ERK at boutons and potentiate presynaptic function. a Kymographs represent the visit of SIPA1L2-amphisome labeled by SNAP-SIPA1L2 (+SiR647) to a bouton identified by Sy-EKAR. b Representative heat maps depicting GFP lifetime (n.s.) over time. Lifetime0 represents the frame when the amphisome reaches the bouton. Scale bar is 5 μm. c, d Quantification of GFP-∆Lifetime over time in visited and nonvisited boutons. Amphisomal arrival is considered as time 0. Control in d represents data from axons where no trajectories were found. N numbers represent analyzed boutons from n > 3 independent experiments. e Averaged GFP-∆Lifetimes from c, d. One-way ANOVA with Bonferroni’s posthoc test; n = number of boutons. f Representative confocal images from wt and sipa1l2−/ primary neurons overexpressing fl-SIPA1L2-mCherry, SIPA1L2-Δ14-mCherry or mCherry, treated with TrkB-Fc or BDNF and immunostained for Synapsin1,2 (Syn) and phospho-SynS62. White arrows show nontransfected boutons. Insets depict boutons labeled with the asterisk. Scale bar is 5 µm. g Percentage of enhancement of the pSynS62/Syn ratio in BDNF-treated as compared to Trk-Fc-treated neurons. P values correspond to comparisons with Fc-TrkB-treated cells for the corresponding condition (Kruskall-Wallis test with Dunn’s correction; wt-tRFP-Fc-TrkB = 20 axons; ko-tRFP-Fc-TrkB = 13 axons; ko-SIPA1L2-Fc-TrkB = 10 axons; ko-SIPA1L2d14-Fc-TrkB = 15 axons; two independent experiments). h Scheme showing the timeline of the experiment: FM4-64 (10 µM) was loaded in the terminals by a train of pulses (30 s @ 20 Hz) and washed out for 10 min. First FM4-64 unloading was done by delivering 900 pulses@10 Hz. Trafficking of TrkB-GFP or GFP-LC3b was imaged for 10 min before a second unloading protocol was applied. i Representative images showing an axon overexpressing GFP-LC3b after loading with FM4-64 (red). Scale bar is 10 μm. j Kymographs prepared from an axonal segment overexpressing GFP-LC3b and loaded with FM4-64. km Unloading rate after visits of TrkB-GFP (k) or GFP-LC3b (l) and from nonvisited boutons (m). Dots indicate boutons. Right panels show the frequency distribution of unloading rates (paired Student’s t test in k, l and Wilcoxon rank test in m). Shaded lines in kymographs (a, j) represent visited (red) and nonvisited (green) boutons. Bar graphs show mean ± SEM. n.s. stands for not significant. "*", "**", "***" indicate P ≤ 0.05, P≤0.01, P ≤ 0.001, respectively.
Fig. 9
Fig. 9
SIPA1L2 controls trafficking and signaling of TrkB-amphisomes at boutons. Signaling amphisomes result from the fusion of active TrkB containing late endosomes with autophagosomes (1). Retrograde trafficking and signaling of these amphisomes in axons are tightly regulated by SIPA1L2, which directly binds to TrkB, Snapin, and LC3b. While the binding to Snapin serves as a linker to a dynein motor, binding of LC3b enhances SIPA1L2 RapGAP activity which negatively interferes with TrkB/Rap1-signaling and also slows down the velocity of retrograde transport. (2) The amphisome halts at single presynaptic boutons in a PKA-dependent manner. PKA-dependent phosphorylation of Snapin triggers its dissociation from the motor complex and immobilizing the amphisome at individual axon terminals. (3) PKA activity also terminates RapGAP activity by phosphorylating SIPA1L2 and allows TrkB/Rap1 signaling that subsequently activates synaptic ERK and facilitates transmitter release.

References

    1. Valdez G, et al. Pincher-mediated macroendocytosis underlies retrograde signaling by neurotrophin receptors. J. Neurosci. 2005;25:5236–5247. doi: 10.1523/JNEUROSCI.5104-04.2005. - DOI - PMC - PubMed
    1. Philippidou P, et al. Trk retrograde signaling requires persistent, Pincher-directed endosomes. Proc. Natl. Acad. Sci. USA. 2011;108:852–857. doi: 10.1073/pnas.1015981108. - DOI - PMC - PubMed
    1. Zheng J, et al. Clathrin-dependent endocytosis is required for TrkB-dependent Akt-mediated neuronal protection and dendritic growth. J. Biol. Chem. 2008;283:13280–13288. doi: 10.1074/jbc.M709930200. - DOI - PubMed
    1. Howe CL, Mobley WC. Long-distance retrograde neurotrophic signaling. Curr. Opin. Neurobiol. 2005;15:40–48. doi: 10.1016/j.conb.2005.01.010. - DOI - PubMed
    1. Kim S, Mizoguchi A, Kikuchi A, Takai Y. Tissue and subcellular distributions of the smg-21/rap1/Krev-1 proteins which are partly distinct from those of c-ras p21s. Mol. Cell Biol. 1990;10:2645–2652. doi: 10.1128/MCB.10.6.2645. - DOI - PMC - PubMed

Publication types

MeSH terms