. 2019 Nov 29;9(1):17912.
doi: 10.1038/s41598-019-53036-1.

Brazilian montane rainforest expansion induced by Heinrich Stadial 1 event

Affiliations

Brazilian montane rainforest expansion induced by Heinrich Stadial 1 event

Jorge L D Pinaya et al. Sci Rep. .

Abstract

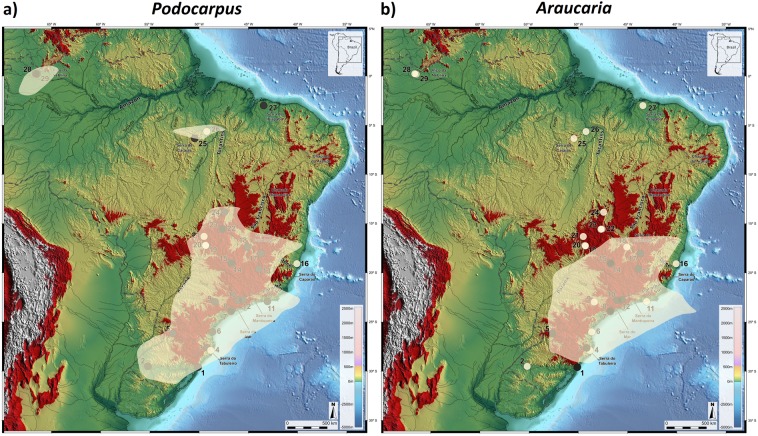
The origin of modern disjunct plant distributions in the Brazilian Highlands with strong floristic affinities to distant montane rainforests of isolated mountaintops in the northeast and northern Amazonia and the Guyana Shield remains unknown. We tested the hypothesis that these unexplained biogeographical patterns reflect former ecosystem rearrangements sustained by widespread plant migrations possibly due to climatic patterns that are very dissimilar from present-day conditions. To address this issue, we mapped the presence of the montane arboreal taxa Araucaria, Podocarpus, Drimys, Hedyosmum, Ilex, Myrsine, Symplocos, and Weinmannia, and cool-adapted plants in the families Myrtaceae, Ericaceae, and Arecaceae (palms) in 29 palynological records during Heinrich Stadial 1 Event, encompassing a latitudinal range of 30°S to 0°S. In addition, Principal Component Analysis and Species Distribution Modelling were used to represent past and modern habitat suitability for Podocarpus and Araucaria. The data reveals two long-distance patterns of plant migration connecting south/southeast to northeastern Brazil and Amazonia with a third short route extending from one of them. Their paleofloristic compositions suggest a climatic scenario of abundant rainfall and relative lower continental surface temperatures, possibly intensified by the effects of polar air incursions forming cold fronts into the Brazilian Highlands. Although these taxa are sensitive to changes in temperature, the combined pollen and speleothems proxy data indicate that this montane rainforest expansion during Heinrich Stadial 1 Event was triggered mainly by a less seasonal rainfall regime from the subtropics to the equatorial region.


Conflict of interest statement

The authors declare no competing interests.

Figures

Figure 1
Figure 1
Presence (red circles) and absence (white circles) of Podocarpus (a) and Araucaria (b) pollen in HS1 records of Brazil. Areas above 610 m elevation are highlighted in red. Dashed line is the border of Brazil. Base layer: Shaded relief image of ETOPO1 Global DEM (continental area: shaded relief illumination from 060°N, 30° above horizon, 40 times vertical exaggeration; oceanic area: illumination from 060°N, 20° above horizon, 5 times vertical exaggeration).
Figure 2
Figure 2
SSA, SSN and SSB migration routes for montane taxa during HS1 and pollen record locations in Brazil (open circles). Route SSA extends from southern/southeastern Brazil to southern Amazonia in the State of Pará. Route SSN extends from Southern-Southeastern to Northeastern Brazil lacks palynological support but is supported by modern distributions of montane taxa and Lagoa do Caçó (sedimentary record 28). SSB route connects coastal southern and southeastern sites up to 18°S synchronous with polar air mass incursions and lowered temperatures as supported by pollen evidence. Areas above 610 m elevation are highlighted in red. Dashed line is the border of Brazil. Base layer: Shaded relief image of ETOPO1 Global DEM (continental area: shaded relief illumination from 060°N, 30° above horizon, 40 times vertical exaggeration; oceanic area: illumination from 060°N, 20° above horizon, 5 times vertical exaggeration).
Figure 3
Figure 3
Montane forest potential distribution during HS1 represented by Podocarpus (a) and Araucaria (b), where black and white circles indicate presence and absence, respectively, in pollen records. White areas show SDM maps generated in MaxEnt version 3.3.3k for prediction of montane forests, using presence in pollen records during HS1 correlated with climatic layers from CCSM3 Trace21k dataset. Areas above 610 m elevation are highlighted in red. Dashed line is the border of Brazil. Base layer: Shaded relief image of ETOPO1 Global DEM (continental area: shaded relief illumination from 060°N, 30° above horizon, 40 times vertical exaggeration; oceanic area: illumination from 060°N, 20° above horizon, 5 times vertical exaggeration).
Figure 4
Figure 4
Boxplot of monthly averages of convective precipitation rate (PRECC) in mm/month (a) and mean monthly surface temperature TS °C (b) at Chapada do Apodi, next to Caçó Lake, derived from Simulation of the Transient Climate of the Last 21000 Years (TraCE-21k) during HS1. R-scripts were generated to produce boxplots.
Figure 5
Figure 5
Scatter plot of altitude (m) vs. latitude (°S) for Podocarpus (a) and Araucaria (b) as indicated by presence (filled circles) and absence (clear circles) in pollen records during HS1. R-scripts were generated to produce the scatter plot.
Figure 6
Figure 6
Modern Potential Distribution maps for Podocarpus (a) and Araucaria angustifolia (b) where occurrences of taxa are shown by yellow and blue dots, respectively. White areas show SDM maps generated by MaxEnt version 3.3.3k for prediction of montane forest, using presence from SpeciesLink and SiBBr/GBIF database and 19 bioclimatic data layers from WorldClim dataset version 2.0. Areas above 610 m elevation are highlighted in red. Dashed line is the border of Brazil. Base layer: Shaded relief image of ETOPO1 Global DEM (continental area: shaded relief illumination from 060°N, 30° above horizon, 40 times vertical exaggeration; oceanic area: illumination from 060°N, 20° above horizon, 5 times vertical exaggeration).
Figure 7
Figure 7
PCA biplot for the modern distribution of Podocarpus lambertii and Araucaria angustifolia in relation to mean values of total annual precipitation, performed by PAST 3.21 (a). Boxplots of each annual total precipitation value representing number of years (2000–2015) for Podocarpus lambertii (1520 ± 220 mm) (b) and Araucaria angustifolia (1680 ± 180 mm) (c). Scatter plot of Total Annual Precipitation (mm) vs. Latitude (°) of modern distribution for Podocarpus lambertii and Araucaria angustifolia, respectively (d,e). Precipitation data were based on hourly rainfall estimates with CMORPH between 2000 and 2015, corrected by the Brazilian meteorological station network. R-scripts were generated to produce boxplots and the scatter plot.
Figure 8
Figure 8
PCA biplot (a) for modern distribution of Araucaria angustifolia in relation to mean values of total annual precipitation, performed by PAST 3.21. Annual (b), wet (c) and dry (d) season histograms for total precipitation values representing number of years (2000–2015), in relation to mean values of total monthly precipitation. Precipitation data were based on hourly rainfall estimates with CMORPH between 2000 and 2015, corrected by the Brazilian meteorological station network. R-scripts were generated to produce boxplots and the scatter plot.

References

    1. Maguire Bassett. On the Flora of the Guayana Highland. Biotropica. 1970;2(2):85. doi: 10.2307/2989766. - DOI
    1. Harley, R. M. & Stannard, B. L. Flora of the Pico das Almas, Chapada Diamantina, Brazil. Flora Pico das Almas, Chapada Diam. Brazil (1995).
    1. Cruz FW, et al. Stable isotope study of cave percolation waters in subtropical Brazil: Implications for paleoclimate inferences from speleothems. Chem. Geol. 2005;220:245–262. doi: 10.1016/j.chemgeo.2005.04.001. - DOI
    1. Cruz FW, Burns SJ, Karmann I, Sharp WD, Vuille M. Reconstruction of regional atmospheric circulation features during the late Pleistocene in subtropical Brazil from oxygen isotope composition of speleothems. Earth Planet. Sci. Lett. 2006;248:494–506. doi: 10.1016/j.epsl.2006.06.019. - DOI
    1. Stríkis NM, et al. Timing and structure of Mega-SACZ events during Heinrich Stadial 1. Geophys. Res. Lett. 2015;42:5477–5484. doi: 10.1002/2015GL064048. - DOI

Publication types