. 2019 Nov 29;9(1):17874.
doi: 10.1038/s41598-019-54248-1.

Functional maturation of human neural stem cells in a 3D bioengineered brain model enriched with fetal brain-derived matrix

Affiliations

Functional maturation of human neural stem cells in a 3D bioengineered brain model enriched with fetal brain-derived matrix

Disha Sood et al. Sci Rep. .

Abstract

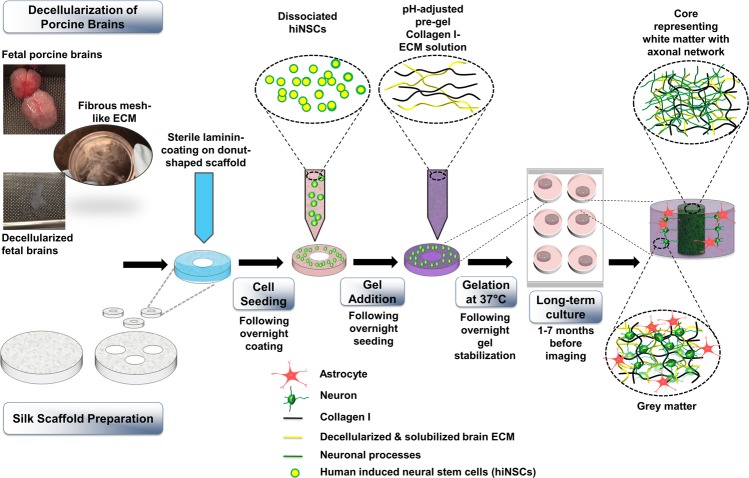
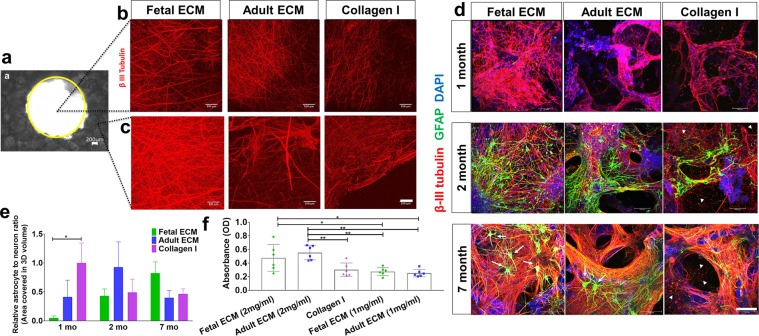
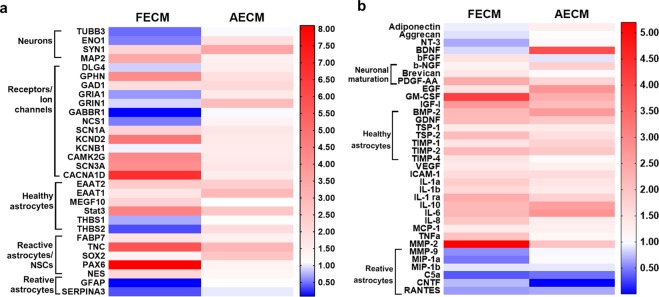
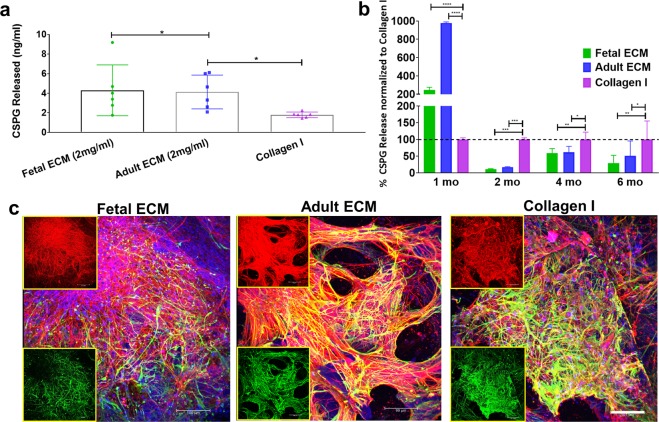
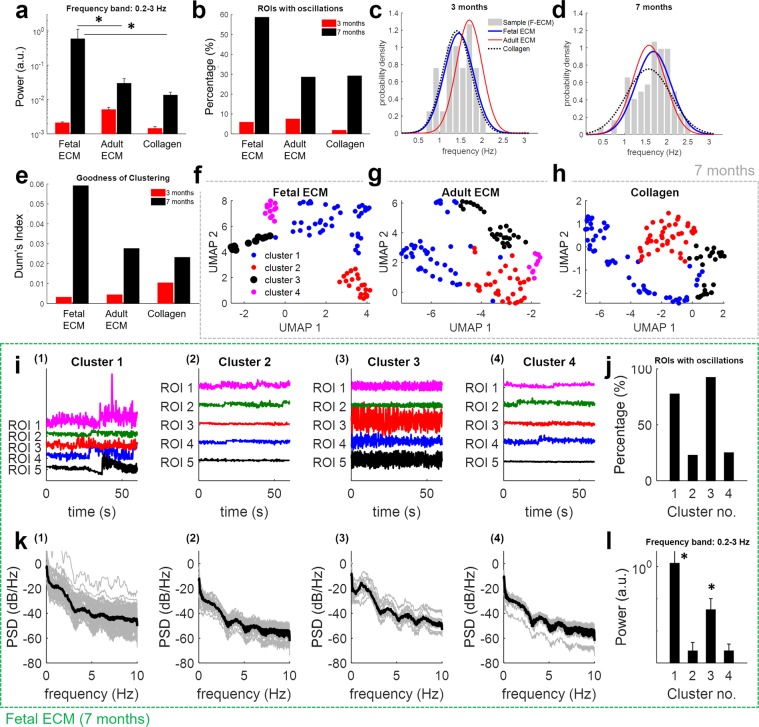
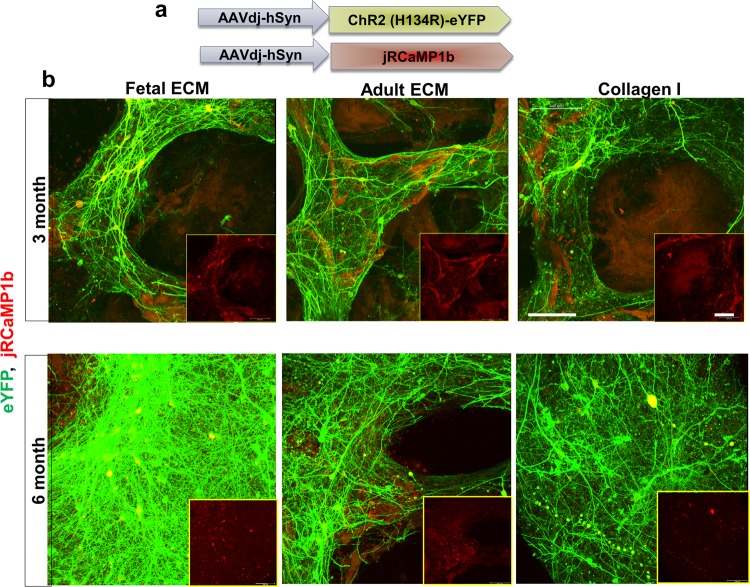
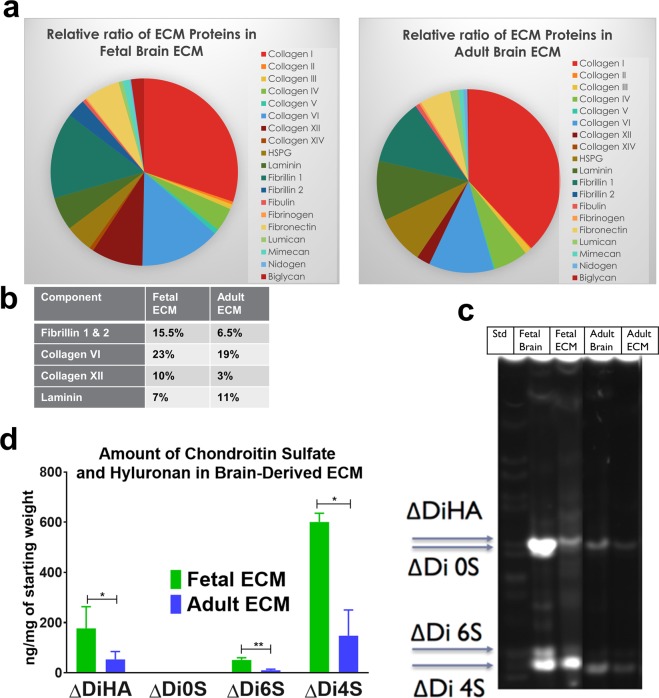
Brain extracellular matrix (ECM) is often overlooked in vitro brain tissue models, despite its instructive roles during development. Using developmental stage-sourced brain ECM in reproducible 3D bioengineered culture systems, we demonstrate enhanced functional differentiation of human induced neural stem cells (hiNSCs) into healthy neurons and astrocytes. Particularly, fetal brain tissue-derived ECM supported long-term maintenance of differentiated neurons, demonstrated by morphology, gene expression and secretome profiling. Astrocytes were evident within the second month of differentiation, and reactive astrogliosis was inhibited in brain ECM-enriched cultures when compared to unsupplemented cultures. Functional maturation of the differentiated hiNSCs within fetal ECM-enriched cultures was confirmed by calcium signaling and spectral/cluster analysis. Additionally, the study identified native biochemical cues in decellularized ECM with notable comparisons between fetal and adult brain-derived ECMs. The development of novel brain-specific biomaterials for generating mature in vitro brain models provides an important path forward for interrogation of neuron-glia interactions.


Conflict of interest statement

The authors declare no competing interests.

Figures

Figure 1
Figure 1
Culture of human induced neural stem cells in 3D in vitro bioengineered brain tissue constructs infused with decellularized brain ECM-collagen I hydrogel. The process starts with decellularization of porcine brains and silk scaffold preparation. Scaffolds are punched into 6 mm diameter constructs with a 2 mm diameter central hole. Laminin-coated scaffolds are seeded with dissociated human induced neural stem cells (hiNSCs). Decellularized ECM is mixed with collagen I and added to the scaffolds seeded with cells. The cell-seeded silk-scaffolds are flooded with media after complete gelation of ECM-collagen I. The center of the construct shows a dense axonal network, surrounded by the neuronal cell bodies and astrocytes. “Adapted with permission from Sood, Disha, et al. “Fetal brain extracellular matrix boosts neuronal network formation in 3D bioengineered model of cortical brain tissue.” ACS biomaterials science & engineering 2.1 (2015): 131–140. Copyright 2016 American Chemical Society.”
Figure 2
Figure 2
Extracellular matrix and time-dependent differentiation of human induced neural stem cells in 3D cultures. Human induced neural stem cells (hiNSCs) in silk scaffold-based 3D constructs infused with collagen I hydrogels supplemented with native porcine brain-derived ECM. (a) Brightfield image of silk scaffold with the middle circular window indicated by the yellow outline. (b) Growth of differentiating hiNSCs at 6 wk. shown by β-III tubulin staining for neurons within the middle hydrogel window of the 3D donut-shaped constructs. Max projection of z-stack. Scale bar 100 μm. (c) Growth of differentiating hiNSCs at 6 wk. shown by β-III tubulin staining for neurons within the ring portion of the 3D donut-shaped constructs. Max projection of z-stack. Scale bar 100 μm. (d) Growth and differentiation of hiNSCs at 1, 2 and 7 mo. shown by β-III tubulin staining for neurons (red) and GFAP staining for astrocytes (green) across different ECM conditions. Max projection of z-stack. Scale bar 100 μm. Arrows point to the star shaped astrocytes and arrow heads to the disintegrated axons and neuronal debris. (e) Astrocyte to neuron ratio calculated by dividing the total volume in 3D confocal stacks covered by astrocytes versus neurons post image processing. Mean ± SEM, One-way ANOVA with Dunnett’s post hoc test (Collagen I as control condition) at each time point on log transformed data, n = 3–6 individual scaffolds per condition. (f) Wst-1 viability assay at 2.5 mo. in 3D hiNSC cultures. One-way ANOVA with Tukey’s post hoc for multiple comparisons. *p < 0.0431, **p < 0.0071.
Figure 3
Figure 3
Gene expression and secretome changes in 3D bioengineered human induced neural stem cell cultures (hiNSCs) cultured in decellularized fetal or adult brain ECM. (a) Left and right panels indicate fold change in gene expression within fetal ECM and adult ECM-enriched constructs relative to collagen I condition, respectively. n = 3 pooled per condition at 1 month. (b) Cytokine release profile of differentiating hiNSCs in 3D bioengineered cultures at 1 month. Media was pooled from n = 7 samples per condition for the cytokine microarray. It can be noted from the heatmap scale that overall much more upregulation was observed than downregulation. Refer to Supplementary Tables 1–2 for the detailed list of genes and cytokines.
Figure 4
Figure 4
Chondroitin sulfate proteoglycans as a marker of astrocyte maturity or reactive astrogliosis. The amount of chondroitin sulfate proteoglycans (CSPGs) released in media by the cells within 3D constructs. (a) CSPGs released in media from collagen-based 3D constructs at 1 wk., expressed in ng/ml. Ordinary way ANOVA on log transformed data followed by Tukey’s posthoc test. (b) Percentage release of CSPGs in media from collagen-based 3D constructs at different time points. Ordinary two-way ANOVA with Dunnett’s post hoc test and Collagen I as control condition, n = 3–6. (c) Differentiating hiNSCs at 3 mo. shown by β-III Tubulin staining for neurons (red) and GFAP staining for astrocytes (green) across different ECM conditions. Insets show the red and green channels separately. Max projection of z-stack. Scale bar 100 μm. *p < 0.0407, **p < 0.0097, ***p < 0.0003, ****p < 0.0001.
Figure 5
Figure 5
Effects of ECM on spontaneous calcium activity in 3D cultures of differentiating human neural stem cells. Panels a–h) summarize the results of the spectral analysis and cluster analysis of the change in fluorescence ΔF/F for ROIs identified at 3 months and 7 months from constructs with fetal ECM, adult ECM, and Collagen I. Panel a) reports the power in the frequency band [0.2, 3] Hz for ΔF/F signals at 3 months (red bars) and 7 months (black bars). Values are mean ± S.E.M. across N ROIs. Values at 3 months: N = 341 (fetal ECM), 294 (adult ECM), 277 (Collagen I) from n = 3 cultures. Values at 7 months: N = 87 (fetal ECM), 112 (adult ECM), 120 (Collagen I) from n = 3 cultures. Asterisks denote significant difference between groups at 3 months versus 7 months and between groups with different ECM constructs (two-way ANOVA with Tukey’s post hoc test, P-value P < 0.01). Panel b) reports the percentage of ROIs at 3 months (red bars) and 7 months (black bars) whose ΔF/F time series exhibit significant oscillations for different types of ECM constructs. Percentages are calculated over N ROIs, with N as in panel a). Panel c,d) report the probability distribution function (PDF) of the frequency f of significant oscillations detected in ROIs from fetal ECM (blue lines), adult ECM (red lines), and Collagen I (dotted black lines) at 3 months (c) and 7 months (d). Each PDF is a Normal function fitted on the sample distribution of frequency f. Gray bars in (c,d) report the sample distribution of frequency f for ROIs from fetal ECM (F-ECM) constructs at 3 months and 7 months, respectively. Panel e) reports the Dunn’s index for the clustering performed on N ROIs at 3 months (red bars) and 7 months (black bars) from constructs with fetal ECM, adult ECM, and Collagen I. Values of N are as in panel a). Dunn’s index is computed on the UMAP components of the feature vectors. See Methods section for details. Panel f–h) report the UMAP plot of the ROIs from fetal ECM (f: N = 87), adult ECM (g: N = 112), and Collagen I (h: N = 120) constructs at 7 months colored by four clusters. Clustering was conducted separately for each construct. Panel i–l) recapitulate the behavior of spontaneous calcium activity from different clusters isolated at 7 months in constructs with fetal ECM. For cluster 1 through 4, Panel i) reports fluorescence signals ΔF/F from five sample ROIs from the cluster, while Panel k) reports the power spectrum density (PSD) of all ROIs in the cluster (gray lines, one line per ROI) and their median PSD (thick black line). Sub-panels (1), (2), (3), and (4) in (ik) are for cluster 1, 2, 3, and 4, respectively. Number of ROIs per cluster are M = 40 (cluster 1), 22 (cluster 2), 13 (cluster 3), and 12 (cluster 4), respectively. Panel j) reports the percentage of ROIs in each cluster whose ΔF/F time series exhibit significant oscillations. Panel l) reports the power in the frequency band [0.2, 3] Hz for ΔF/F signals in each cluster. Values are mean ± S.E.M. across M ROIs, with M as in (ik). Asterisks denote significant difference between clusters (one-way ANOVA with Tukey-Kramer post hoc test, P-value P < 0.01).
Figure 6
Figure 6
Transduction of differentiating human induced neural stem cells for tracking mature neurons. (a) High transduction efficiency virus, AAV-dj for expression of eYFP throughout the cell volume, a channelrhodopsin ChR2 (H134R) and calcium sensor jRCAMP1b under the synapsin promoter. (b) eYFP (green) and jRCAMP1b (red) expression at 3 and 6 mo. in mature neurons differentiated from hiNSCs in silk scaffold-based 3D constructs infused with collagen I hydrogels supplemented with native porcine brain-derived ECM. Insets show jRCAMP1b channel only. Max projection of Z-stack. Scale bar 100 μm.
Figure 7
Figure 7
ECM composition analysis using LC/MS and fluorescence assisted carbohydrate electrophoresis. (a) Relative ratios of ECM proteins in fetal versus adult porcine brain decellularized matrix obtained through LC/MS. (b) Table indicating the relative percentages of a few select ECM components in decellularized brain matrix. (c) Characterization of decellularized fetal & adult brain ECM in comparison to fetal and adult whole brains by FACE. Chondroitin sulfate (CS) and hyaluronan (HA) bands in the fetal & adult porcine brain ECM. ΔDiHA: hyaluronan, ΔDi0S: non-sulfated CS, ΔDi6S: 6-sulfated CS, ΔDi4S: 4-sulfated CS. (d) Overall higher quantity of GAGs present in fetal brain ECM, as opposed to adult brain ECM. Unpaired two-tailed t-tests on log-transformed data between individual pairs, n = 3, *p < 0.0439, **p = 0.0040.

Similar articles

Cited by

References

    1. Camp JG, et al. Human cerebral organoids recapitulate gene expression programs of fetal neocortex development. Proc Natl Acad Sci USA. 2015;112:15672–15677. doi: 10.1073/pnas.1508055112. - DOI - PMC - PubMed
    1. Lancaster MA, et al. Cerebral organoids model human brain development and microcephaly. Nature. 2013;501:373–379. doi: 10.1038/nature12517. - DOI - PMC - PubMed
    1. Luo C, et al. Cerebral Organoids Recapitulate Epigenomic Signatures of the Human Fetal Brain. Cell Rep. 2016;17:3369–3384. doi: 10.1016/j.celrep.2016.12.001. - DOI - PMC - PubMed
    1. Giandomenico SL, Lancaster MA. Probing human brain evolution and development in organoids. Curr Opin Cell Biol. 2017;44:36–43. doi: 10.1016/j.ceb.2017.01.001. - DOI - PubMed
    1. Quadrato G, et al. Cell diversity and network dynamics in photosensitive human brain organoids. Nature. 2017;545:48–53. doi: 10.1038/nature22047. - DOI - PMC - PubMed

Publication types

MeSH terms

Substances