. 2019 Nov 29;9(1):17963.
doi: 10.1038/s41598-019-54292-x.

Altered generation of ciliated cells in chronic obstructive pulmonary disease

Affiliations

Altered generation of ciliated cells in chronic obstructive pulmonary disease

Sophie Gohy et al. Sci Rep. .

Abstract

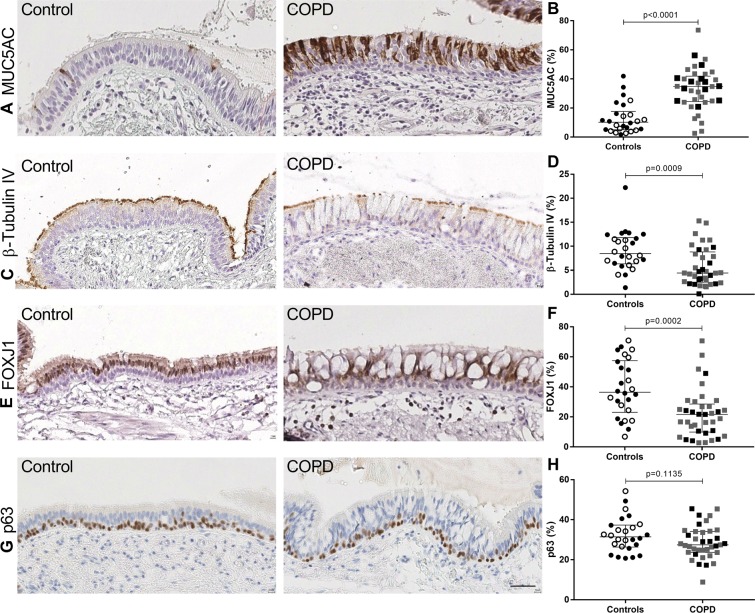
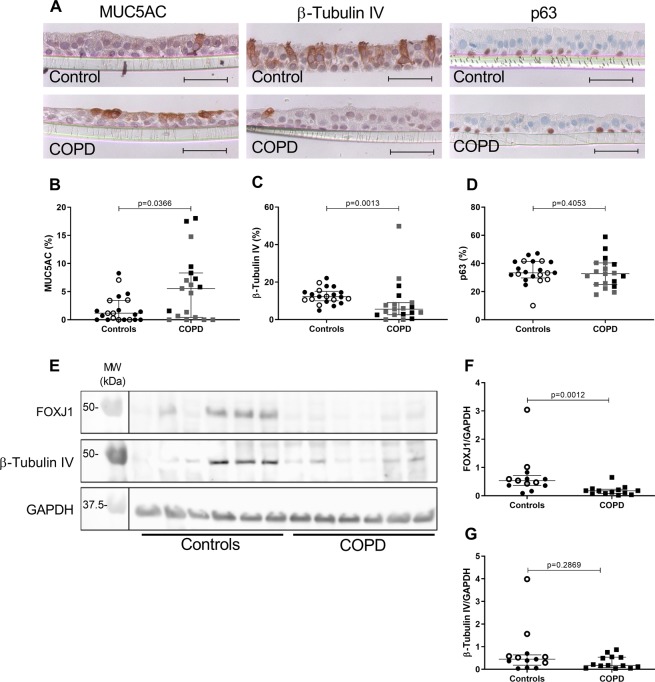
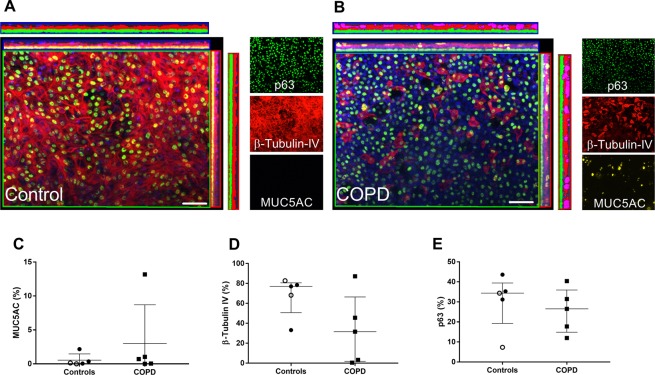
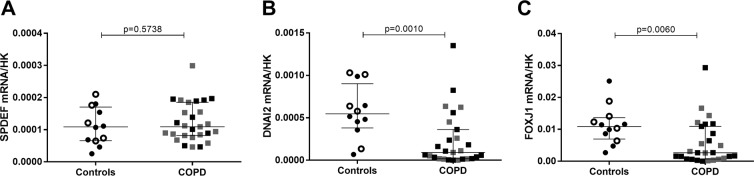
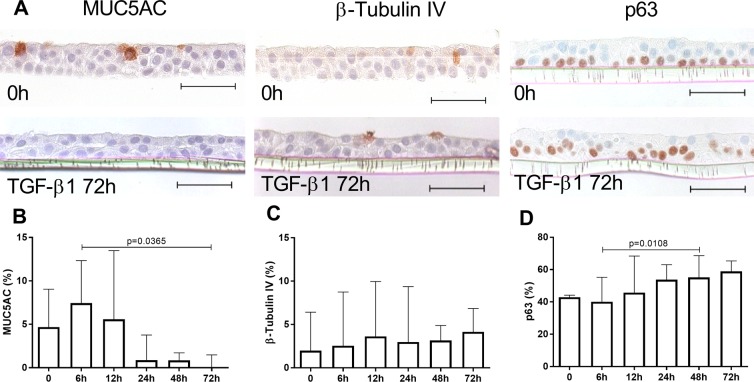
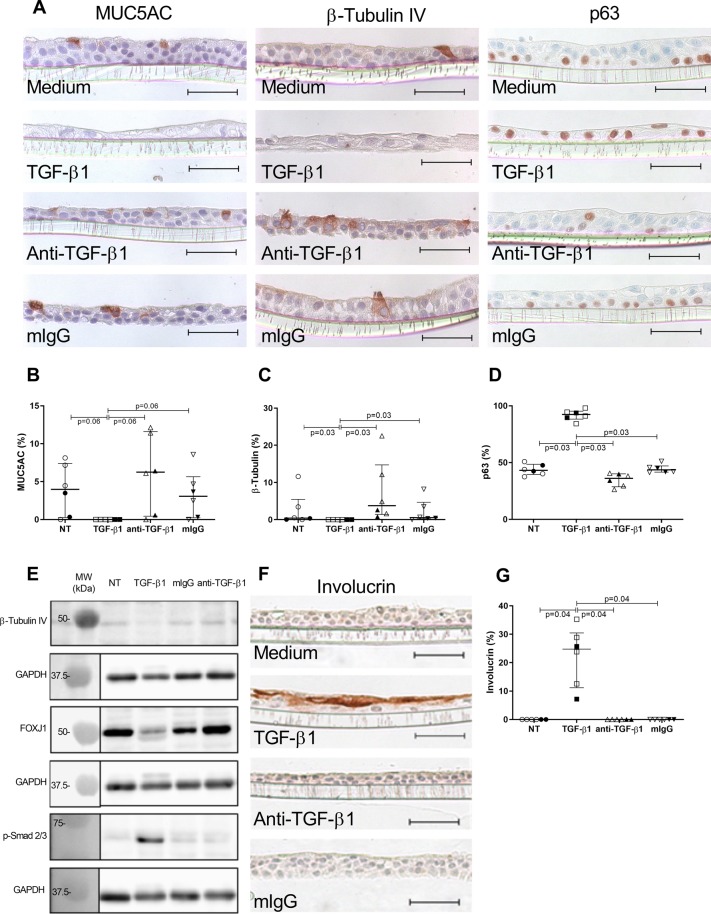
In COPD, epithelial changes are prominent features in the airways, such as goblet cell hyperplasia and squamous metaplasia. In contrast, it remains unclear whether ciliated cells are reduced and which pathways dysregulate epithelial differentiation. We hypothesized that bronchial epithelial cell lineage specification is dysregulated in COPD because of an aberrant reprogramming through transforming growth factor (TGF)-β1. Surgical lung tissue from 81 COPD and 61 control (smokers and non-smokers) patients was assessed for bronchial epithelial cell phenotyping by immunohistochemistry, both in situ and in vitro in reconstituted air-liquid interface (ALI) cultures. The role of TGF-β1 was studied in vitro. COPD epithelium in large airways, when compared to controls, showed decreased β-tubulin IV + ciliated cells (4.4%, 2.5-8.8% versus 8.5%, 6.3-11.8% of surface staining, median and IQR, p = 0.0009) and increased MUC5AC + goblet cells (34.8%, 24.4-41.9% versus 10.3%, 5.1-17.6%, p < 0.0001). Both features were recapitulated in the ALI-cultured epithelium from COPD patients. Exogenous TGF-β1 reduced mucociliary differentiation while neutralizing TGF-β1 during ALI increased both specialized cell types. The COPD airway epithelium displays altered differentiation for ciliated cells, which recapitulates in vitro, at least in part through TGF-β1.


Conflict of interest statement

The authors declare no competing interests.

Figures

Figure 1
Figure 1
Cell lineage immunophenotyping in large airways. (A) IHC for MUC5AC (goblet cells), in large airways of a control and a COPD patient. (B) Quantification of MUC5AC staining in large airways expressed in percentage of positive area (n = 63). (C) IHC for ß-tubulin IV (ciliated cells) in large airways of a control and a COPD patient. (D) Quantification of ß-tubulin IV staining in large airways expressed in percentage of positive area (n = 63). (E) IHC for FOXJ1 staining (ciliated cells) in large airways of a control and a COPD patient. (F) Quantification of FOXJ1 staining in large airways expressed in percentage of positive cells (n = 63). (G) IHC for p63 (basal cells) in large airways of a control and a COPD patient. (H) Quantification of p63 staining in large airways expressed in percentage of positive cells (n = 63). Scale bar, 50 µm. White dots represent non-smoker controls and black dots current smoker controls, grey squares represent mild and moderate COPD and black squares severe and very severe COPD. Mann-Whitney U test.
Figure 2
Figure 2
Cell lineage immunophenotyping in small airways. (A) IHC for MUC5AC (goblet cells), in small airways of a control and a COPD patient. (B) Quantification of MUC5AC staining in small airways expressed in percentage of positive area (n = 54). (C) IHC for ß-tubulin IV (ciliated cells) in small airways of a control and a COPD patient. (D) Quantification of ß-tubulin IV staining in small airways expressed in percentage of positive area (n = 54). (E) IHC for p63 (basal cells) in small airways of a control and a COPD patient. (F) Quantification of p63 staining in small airways expressed in percentage of positive cells (n = 54). (G) IHC for CK13 (basal cells) in small airways of a control and a COPD patient. (H) Quantification of CK13 staining in small airways expressed in percentage of positive cells (n = 41). Scale bar, 50 µm. White dots represent non-smoker controls and black dots current smoker controls, grey squares represent mild and moderate COPD and black squares severe and very severe COPD. Mann-Whitney U test.
Figure 3
Figure 3
Cell lineage immunophenotyping in ALI-HBEC. (A) IHC for MUC5AC (goblet cells), ß-tubulin IV (ciliated cells) and p63 (basal cells) in ALI-HBEC of a control and a COPD patient. (B) Quantification of MUC5AC staining in ALI-HBEC expressed in percentage of positive cells (n = 40). (C) Quantification of ß-tubulin IV staining in ALI-HBEC expressed in percentage of positive cells (n = 40). (D) Quantification of p63 staining in ALI-HBEC expressed in percentage of positive cells (n = 40). (E) Immunoblot for FOXJ1 (50 kDa), ß-tubulin IV (50 kDa) and GAPDH (37 kDa) expression in cellular lysates of ALI-HBEC from controls and COPD patients (n = 12). (F) Quantification of FOXJ1 protein, as referred to GAPDH in cellular lysates of ALI-HBEC from controls and COPD patients (n = 26). (G) Quantification of ß-tubulin IV protein, as referred to GAPDH in cellular lysates of ALI-HBEC from controls and COPD patients (n = 26). Scale bar, 50 µm. White dots represent non-smoker controls and black dots current smoker controls, grey squares represent mild and moderate COPD and black squares severe and very severe COPD. Mann-Whitney U test.
Figure 4
Figure 4
Cell lineage immunophenotyping in ALI-HBEC by immunofluorescence. (A,B) Immunofluorescence for MUC5AC (yellow staining and pink quantification mask), ß-tubulin IV (red staining and quantification mask) and p63 (green staining and quantification mask) in ALI-HBEC from one control non-smoker (A) and one severe COPD patient (B). Nucleus are stained in blue by DAPI. (C) Quantification of MUC5AC staining in ALI-HBEC expressed in percentage of positive area (n = 10). (D) Quantification of ß-tubulin IV staining in ALI-HBEC expressed in percentage of positive area (n = 10). (E) Quantification of p63 staining in ALI-HBEC expressed in percentage of positive area (n = 10). Scale bar, 50 µm. White dots represent non-smoker controls and black dots current smoker controls and black squares represent severe and very severe COPD.
Figure 5
Figure 5
Mucociliary differentiation transcription factors expression in ALI-HBEC. (A) SPDEF mRNA expression by RT-qPCR in ALI-HBEC from control and COPD patients, normalized to the geometric mean of the three housekeeping genes (n = 39). (B) DNAI2 mRNA expression by RT-qPCR in ALI-HBEC from control and COPD patients, normalized to the geometric mean of the three housekeeping genes (n = 39). (C) FOXJ1 mRNA expression by RT-qPCR in ALI-HBEC from control and COPD patients, normalized to the geometric mean of the three housekeeping genes (n = 39). White dots represent non-smoker controls and black dots current smoker controls and black squares represent severe and very severe COPD. Mann-Whitney U test.
Figure 6
Figure 6
Short-term effect of TGF-β1 on epithelial cell lineages in control ALI-HBEC. (A) IHC for MUC5AC (goblet cells), ß-tubulin IV (ciliated cells) and p63 (basal cells) in ALI-HBEC without or with 72 h treatment of TGF-ß1 (10 µg/ml). (B) Quantification of MUC5AC staining in ALI-HBEC treated by TGF-ß1 expressed in percentage of positive cells (n = 4). (C) Quantification of ß-tubulin IV staining in ALI-HBEC treated by TGF-ß1 expressed in percentage of positive cells (n = 4). (D) Quantification of p63 staining in ALI-HBEC treated by TGF-ß1 expressed in percentage of positive cells (n = 5). Scale bar, 50 µm. Friedman test and Dunn’s multiple comparison test.
Figure 7
Figure 7
Long-term effect of TGF-β1 and anti-TGF-β1 antibody on epithelial cell lineages. (A) IHC for MUC5AC (goblet cells), ß-tubulin IV (ciliated cells) and p63 (basal cells) in ALI-HBEC using TGF-β1 (10 ng/ml), anti-TGF-β1 antibody (10 µg/ml) and control mouse IgG (10 µg/ml) during the 2 weeks of ALI differentiation (pictures are from a control ex-smoker). (B) Quantification of MUC5AC staining expressed in percentage of positive cells (n = 6), including 4 controls and 2 COPD donors as white and black dots, respectively). (C) Quantification of ß-tubulin IV staining expressed in percentage of positive cells (n = 6, including 4 controls and 2 COPD donors as white and black dots, respectively). (D) Quantification of p63 staining expressed in percentage of positive cells (n = 6, including 4 controls and 2 COPD donors as white and black dots, respectively). (E) Immunoblot for FOXJ1 (50 kDa), ß-tubulin IV (50 kDa), phospho-Smad2/3 (68 kDa) and GAPDH (37 kDa) expression in cellular lysates of ALI-HBEC from controls and COPD patients (n = 6). (F) IHC for involucrin (squamous cells) in ALI-HBEC using TGF-β1 (10 ng/ml), anti-TGF-β1 antibody (10 µg/ml) and control mouse IgG (10 µg/ml) during the 2 weeks of ALI differentiation. (G) Quantification of involucrin staining expressed in percentage of positive cells (n = 6, including 4 controls and 2 COPD donors as white and black dots, respectively, pictures are from a control ex-smoker. Scale bar, 50 µm. Friedman test and Dunn’s multiple comparison test.

References

    1. Global Initiative for Chronic Obstructive Lung Disease. Global Strategy for Diagnosis, M., and Prevention of COPD, updated, http://www.goldcopd.org (2018).
    1. Brusselle GG, Joos GF, Bracke KR. New insights into the immunology of chronic obstructive pulmonary disease. The Lancet. 2011;378:1015–1026. doi: 10.1016/s0140-6736(11)60988-4. - DOI - PubMed
    1. Jeffery PK. Comparison of the structural and inflammatory features of COPD and asthma. Giles F. Filley Lecture. Chest. 2000;117:251S–260S. doi: 10.1378/chest.117.5_suppl_1.251S. - DOI - PubMed
    1. Gras D, Chanez P, Vachier I, Petit A, Bourdin A. Bronchial epithelium as a target for innovative treatments in asthma. Pharmacology & therapeutics. 2013;140:290–305. doi: 10.1016/j.pharmthera.2013.07.008. - DOI - PubMed
    1. Knight DA, Holgate ST. The airway epithelium: structural and functional properties in health and disease. Respirology. 2003;8:432–446. doi: 10.1046/j.1440-1843.2003.00493.x. - DOI - PubMed

Publication types

Substances