. 2020 Apr;28(4):435-444.
doi: 10.1038/s41431-019-0551-x. Epub 2019 Nov 29.

A bird's-eye view of Italian genomic variation through whole-genome sequencing

Affiliations

A bird's-eye view of Italian genomic variation through whole-genome sequencing

Massimiliano Cocca et al. Eur J Hum Genet. 2020 Apr.

Abstract

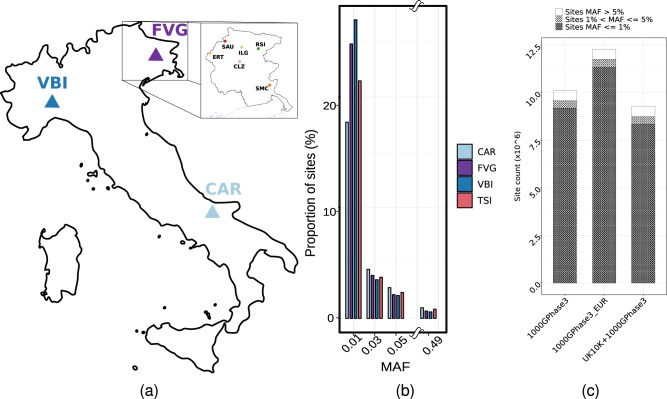
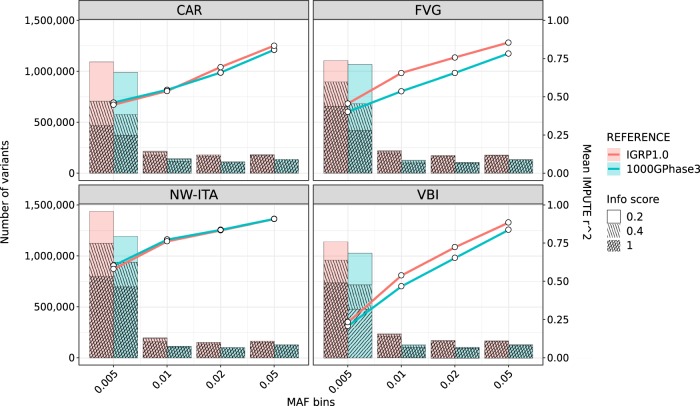
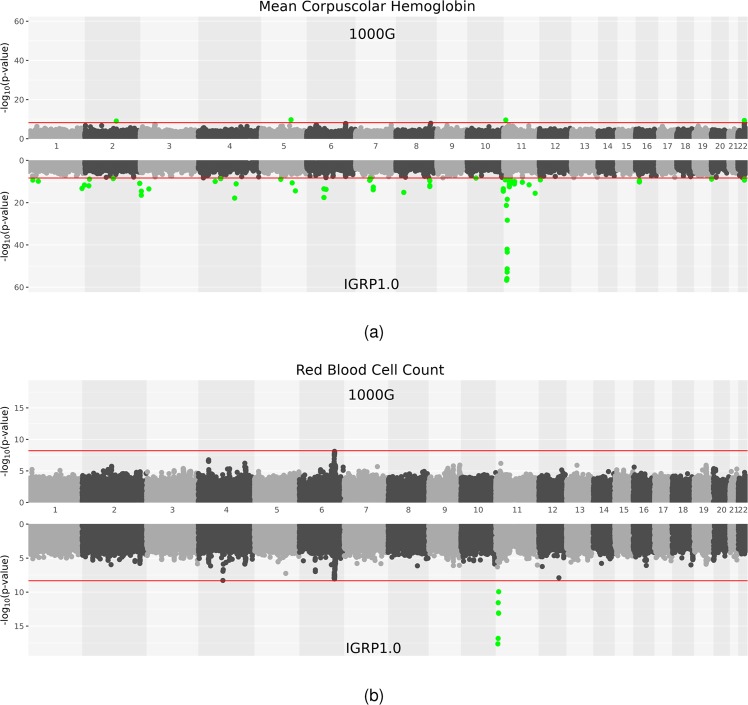
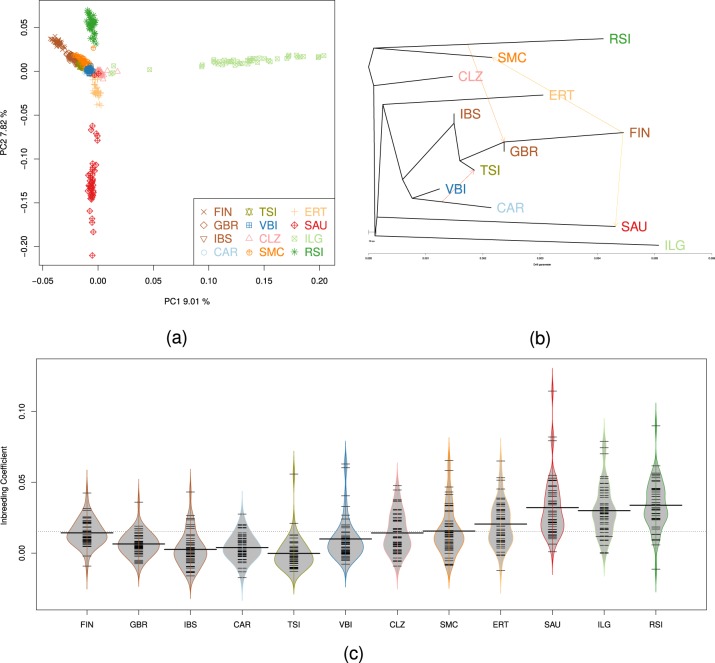
The genomic variation of the Italian peninsula populations is currently under characterised: the only Italian whole-genome reference is represented by the Tuscans from the 1000 Genome Project. To address this issue, we sequenced a total of 947 Italian samples from three different geographical areas. First, we defined a new Italian Genome Reference Panel (IGRP1.0) for imputation, which improved imputation accuracy, especially for rare variants, and we tested it by GWAS analysis on red blood traits. Furthermore, we extended the catalogue of genetic variation investigating the level of population structure, the pattern of natural selection, the distribution of deleterious variants and occurrence of human knockouts (HKOs). Overall the results demonstrate a high level of genomic differentiation between cohorts, different signatures of natural selection and a distinctive distribution of deleterious variants and HKOs, confirming the necessity of distinct genome references for the Italian population.


Conflict of interest statement

The authors declare that they have no conflict of interest.

Figures

Fig. 1
Fig. 1
Dataset description: a Geographical localisation of the three study cohorts. b The minor allele frequency spectrum of the final INGI data set. For comparison, the Minor allele frequency spectrum of the TSI cohort from 1000G Phase 3 data has been added. c The stacked bar-plot represent the number of novel sites identified in the whole INGI dataset, compared with the available resources. The majority of the private INGI sites are in the range of the rare variants (MAF < = 1% - cross-pattern). Singletons sites (AC = 1) are included
Fig. 2
Fig. 2
Imputation accuracy: mean values of r2 (right y-axes) stratified by minor allele frequency (coloured lines) and number of imputed sites (left y-axes) stratified by info score values and minor allele frequency (bar plot) for Italian cohorts. An outbred cohort from North Italy (NW-ITA) was included for comparison
Fig. 3
Fig. 3
GWAS analyses: a Manhattan plot of GWAS meta-analysis on Mean Corpuscular Haemoglobin (MCH) phenotype: results in the bottom panel are from IGRP1.0 imputed data while on the top panel we show GWAS results obtained using the 1000G reference panel for imputation. b Manhattan plot of GWAS meta-analysis on Red Blood Cell Count (RBC) phenotype: results in the bottom panel are from IGRP1.0 imputed data while on the top panel we show GWAS results obtained using the 1000G reference panel for imputation
Fig. 4
Fig. 4
Population genetic analyses: a PCA of Italian samples and European 1000G populations using a subset of 46 individuals from each population. Variance explained by each axis is reported. Each population from FVG cohort - Erto (ERT), Illegio (ILG), Resia (RSI), Sauris (SAU), San Martino del Carso (SMC) and Clauzetto (CLZ) - are shown. The first axis separates ILG from all other Italian populations; the second axis separates SAU from RSI; Val Borbera (VBI) and Carlantino (CAR) cluster with Toscani in Italia (TSI), Finnish in Finland (FIN), British in England and Scotland (GBR), Iberian Population in Spain (IBS). b Treemix graph analyses with 3 migration edges: a link between North European populations and isolates such as RSI and SAU is shown; c Bean plots of Inbreeding coefficient of 1000G European populations and Italian populations. All FVG population have a higher inbreeding coefficient respect to other Italian and European population except for FIN. The plot shows that in the INGI populations the distribution of the inbreeding coefficient values are more sparse with respect to the actual reference Italian population of TSI from 1000G; each horizontal black bar represents an observation from the dataset

References

    1. Gudbjartsson DF, Helgason H, Gudjonsson SA, Zink F, Oddson A, Gylfason A, et al. Large-scale whole-genome sequencing of the Icelandic population. Nat Genet. 2015;47:435–44. doi: 10.1038/ng.3247. - DOI - PubMed
    1. The 1000 Genomes Project Consortium. A global reference for human genetic variation. Nature. 2015;526:68–74. doi: 10.1038/nature15393. - DOI - PMC - PubMed
    1. The UK10K Consortium. The UK10K project identifies rare variants in health and disease. Nature. 2015;526:82–90. doi: 10.1038/nature14962. - DOI - PMC - PubMed
    1. Karczewski KJ, Weisburd B, Thomas B, Solomonson M, Ruderfer DM, Kavanagh D, et al. The ExAC browser: displaying reference data information from over 60 000 exomes. Nucleic Acids Res. 2017;45:D840–5. doi: 10.1093/nar/gkw971. - DOI - PMC - PubMed
    1. The ENCODE Project Consortium. Identification and analysis of functional elements in 1% of the human genome by the ENCODE pilot project. Nature. 2007;447:799–816. doi: 10.1038/nature05874. - DOI - PMC - PubMed

Publication types

LinkOut - more resources