. 2019 Dec;51(12):1664-1669.
doi: 10.1038/s41588-019-0538-0. Epub 2019 Nov 29.

Activity-by-contact model of enhancer-promoter regulation from thousands of CRISPR perturbations

Affiliations

Activity-by-contact model of enhancer-promoter regulation from thousands of CRISPR perturbations

Charles P Fulco et al. Nat Genet. 2019 Dec.

Abstract

Enhancer elements in the human genome control how genes are expressed in specific cell types and harbor thousands of genetic variants that influence risk for common diseases1-4. Yet, we still do not know how enhancers regulate specific genes, and we lack general rules to predict enhancer-gene connections across cell types5,6. We developed an experimental approach, CRISPRi-FlowFISH, to perturb enhancers in the genome, and we applied it to test >3,500 potential enhancer-gene connections for 30 genes. We found that a simple activity-by-contact model substantially outperformed previous methods at predicting the complex connections in our CRISPR dataset. This activity-by-contact model allows us to construct genome-wide maps of enhancer-gene connections in a given cell type, on the basis of chromatin state measurements. Together, CRISPRi-FlowFISH and the activity-by-contact model provide a systematic approach to map and predict which enhancers regulate which genes, and will help to interpret the functions of the thousands of disease risk variants in the noncoding genome.


Conflict of interest statement

Competing Interests Statement

E.S.L. serves on the Board of Directors for Codiak BioSciences and Neon Therapeutics, and serves on the Scientific Advisory Board of F-Prime Capital Partners and Third Rock Ventures; he is also affiliated with several non-profit organizations including serving on the Board of Directors of the Innocence Project, Count Me In, and Biden Cancer Initiative, and the Board of Trustees for the Parker Institute for Cancer Immunotherapy. He has served and continues to serve on various federal advisory committees. C.P.F., E.S.L., and J.M.E. are inventors on a patent application (WO2018064208A1) filed by the Broad Institute related to this work.

Figures
Extended Data Fig. 1
Extended Data Fig. 1. Sorting and sequencing strategy for CRISPRi-FlowFISH Screens
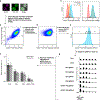
a, K562 cells labeled with FlowFISH probesets against RPL13A (control gene) and GATA1 (gene of interest) imaged by fluorescence microscopy. b, Histograms of FlowFISH signal (arbitrary units of fluorescence) for GATA1 (left) and RPL13A (right) in unlabeled K562s (red), K562s stained for GATA1 expressing a gRNA against the GATA1-TSS (orange), or a non-targeting Ctrl gRNA (blue). Results typical of cells across 2 independent samples (a,b). c, Scatterplot of FlowFISH fluorescent signal for RPL13A versus GATA1. d, Cells in c with cells unstained for RPL13A (below dotted line in c) removed and using the color compensation tool to reduce the correlation between the control gene and gene of interest (see Methods). e, Binning strategy for sorting FlowFISH-labeled cells into 6 bins each containing 10% of the cells. Typical results from 3 independent GATA1 CRISPRi-FlowFISH screens (c-e). f, Effect on gene expression as measured by CRISPRi-FlowFISH (dark grey) and RT-qPCR (light grey). Error bars: 95% confidence intervals for the mean of 2 gRNAs per target, 3505 Ctrl gRNAs for FlowFISH (a random 50 shown), and 6 Ctrl gRNAs for RT-qPCR. n = 3 independent experiments per gRNA for CRISPRi-FlowFISH screens. n = 4 independent samples per gRNA for RT-qPCR. *P < 0.05 in 2-sided t-test versus Ctrl. P-values, test statistics, confidence intervals, effect sizes, and degrees of freedom are available in Supplementary Table 3. g, Counts in each of the 6 bins for single gRNAs targeting the GATA1 TSS, two GATA1 enhancers (DE1 and DE2) identified in Fulco et al., and representative negative controls (Ctrl).
Extended Data Fig. 2
Extended Data Fig. 2. CRISPRi-FlowFISH reproducibly quantifies effects of regulatory elements
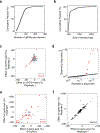
a, Cumulative distribution plot of the number of gRNAs in each tested candidate element. b, Cumulative distribution plot of the width of each tested candidate element. c, Correlation between independent CRISPRi-FlowFISH screens for GATA1. Red points denote elements significantly affecting expression. Pearson R = 0.94 for significant elements, 0.37 for all elements. d, Quantile-quantile plot for GATA1 CRISPRi-FlowFISH screen. Red points denote elements significantly affecting expression. Vertical axis capped at 10−20. e, Pearson correlation between effect on gene expression as measured by CRISPRi-FlowFISH screening and RT-qPCR for 42 E-G pairs tested by both methods. Value is the mean effect of the two gRNAs for each element. f, Pearson correlation between effects on gene expression for all significant E-G pairs measured in biologically independent CRISPRi-FlowFISH screens. P-values, test statistics, confidence intervals, effect sizes, and degrees of freedom for all panels are available in Supplementary Table 3.
Extended Data Fig. 3
Extended Data Fig. 3. Investigating components of the ABC score
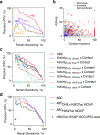
a, Precision-recall curves for classifying regulatory DE-G pairs, comparing each of the components of the ABC score. b, Scatterplot of Activity and Contact frequency for each tested DE-G pair. KR-normalized Hi-C contact frequencies are scaled for each gene so that the maximum score of an off-diagonal bin is 100 (see Methods). c, Precision-recall curves comparing different measures of Activity. ActivityFeature1,Feature2 = sqrt(Feature1 RPM x Feature2 RPM). (ABC score corresponds to ActivityDHS,H3K27ac x Contact). d, Precision-recall curves for the ABC model using H3K27ac HiChIP. ABCDHS x H3K27ac Hi-ChIP corresponds to a predictive model whose score is proportional to the DHS signal at the candidate element multiplied by the H3K27ac Hi-ChIP signal between the element and gene promoter (see Supplementary Methods). ABCH3K27ac Hi-ChIP is the same as above but only uses the existence of the DHS peak as opposed to the quantitative signal in the DHS peak. H3K27ac HiChIP HiCCUPS Loops is the HiCCUPS loop calls derived from the H3K27ac HiChIP experiment (see Supplementary Methods). ABC corresponds to ABCsqrt(DHS x H3K27ac) x Hi-C. These results suggest that the ABC score computed using H3K27ac HiChIP data is an effective predictor of regulatory enhancer-gene connections.
Extended Data Fig. 4
Extended Data Fig. 4. Tissue-specific genes have more distal enhancers than ubiquitously expressed genes
a, Left: Comparison of ABC scores (predicted effect) with observed changes in gene expression upon CRISPR perturbations. Each dot represents one tested DE-G pair where G is a ubiquitously expressed gene. Right: precision-recall curve for ABC score in classifying regulatory DE-G pairs where each G is a ubiquitously expressed gene. b, Same as a for tissue-specific genes. All panels include only the subset of our dataset for which we have CRISPRi tiling data to comprehensively identify all enhancers that regulate each gene (30 genes from this study, 2 from previous studies; see Supplementary Methods).
Fig. 1 |
Fig. 1 |. CRISPRi-FlowFISH identifies regulatory elements for GATA1 and HDAC6.
a, CRISPRi-FlowFISH method for identifying gene regulatory elements. Cells expressing KRAB-dCas9 are infected with a pool of gRNAs targeting DHS elements near a gene of interest, labeled using RNA FISH against that gene, and sorted into bins of fluorescence signal by FACS. The quantitative effect of each gRNA on the expression of the gene is determined by sequencing the gRNAs within each bin. Inset: example of K562 cells labeled for RPL13A. b, Distal elements affecting GATA1 and HDAC6 expression in K562 cells. Genes expressed in K562 cells are shown in black; those not expressed are shown in grey. Red/blue arcs: perturbation of a DE resulted in a significant decrease/increase in the expression of the tested gene. Grey circles are DEs where perturbation with CRISPRi affects the expression of at least one tested gene as measured by CRISPRi-FlowFISH. Distal Elements are DHS peaks. See Supplementary Figure 2a for the full tested region spanning 4 Mb. c, Close-up on region containing GATA1 and HDAC6. Points represent the effect on gene expression of a single gRNA. HDAC6 vertical axis capped at 200%. Grey, red, and blue bars: DHS elements in which CRISPRi leads to no detectable change (grey), or a significant decrease (red) or increase (blue) in expression. Elements overlapping the assayed gene are excluded from analyses because recruitment of KRAB-dCas9 in a gene body directly interferes with transcription. Such elements are included in analyses for other genes, as shown for the elements overlapping GATA1.
Fig. 2 |
Fig. 2 |. CRISPRi-FlowFISH produces regulatory maps of DE-G connections in multiple loci.
a, Example of CRISPRi-FlowFISH screen data. DE-G connections are elements affecting the expression of JUNB, PRDX2, and RNASEH2A in CRISPRi-FlowFISH screens in K562 cells. Red/blue arcs: perturbation of a DE resulted in a significant decrease/increase in the expression of the tested gene. Width of arc corresponds to effect size. Distal elements are DHS peaks. Tested genes refer to genes for which we performed CRISPRi-FlowFISH experiments. See Supplementary Figure 2b for the full tested region spanning 1.4 Mb. b, Same as a for the genes HNRNPA1, NFE2, COPZ1, and ITGA5. See Supplementary Figure 2c for the full tested region spanning 1.2 Mb. c, Histogram of the number of distal elements affecting each gene in our dataset. Panels a-e include both FlowFISH data from this study and tested pairs from other studies. See Supplementary Figure 3 for plots including FlowFISH data only. d, Histogram of the number of genes affected by each distal element tested in our dataset. e, Comparison of genomic distance with observed changes in gene expression upon CRISPR perturbations. Each dot represents one tested DE-G. Red/blue dots: connections where perturbation resulted in a significant decrease/increase in the expression of the tested gene. Grey dots: no significant effect.
Fig. 3 |
Fig. 3 |. The ABC model predicts the target genes of enhancers.
a, Precision-recall plot for classifiers of DE-G pairs. Positive DE-G pairs are those where perturbation of the distal element significantly decreases expression of the gene. Curves represent the performance for predicting significant decreases in expression for DE-G pairs based on thresholds on the ABC score (red) and genomic distance between the DE and the TSS of the gene (black). Circles represent the performance of various predictors in which DEs are assigned to: the TSS of the closest expressed gene (“G”); all promoters within 100 kb (black), genes predicted by the algorithms TargetFinder (“T”) or JEME (“J”); promoters in same Hi-C contact domain (“D”); and promoters at the opposite anchors of Hi-C “loops” (“L”), RNA Polymerase II ChIA-PET loops (“P”), or H3K27ac HiChIP “loops” (“H”); or assigning each expressed gene to the closest DE (“E”). b, Calculation of the ABC score (see Methods). Values for DHS, H3K27ac, and Hi-C are presented in arbitrary units and are not to scale. c, Comparison of ABC scores (predicted effect) with observed changes in gene expression upon perturbations. Each dot represents one tested DE-G pair. Red/blue dots: connections where perturbation resulted in a significant decrease/increase in the expression of the tested gene. Grey dots: no significant effect. Dotted black line marks 70% recall, corresponding to the red dot in a.
Fig. 4 |
Fig. 4 |. The ABC model generalizes across cell types.
a, Comparison of ABC scores (predicted effect) with observed changes in gene expression upon perturbations in GM12878 cells, LNCaP cells, NCCIT cells, primary human hepatocytes, and mouse ES cells. Each dot represents one tested DE-G pair. Red dots: connections where perturbation resulted in a significant decrease in the expression of the tested gene. Grey dots: no significant effect. b, Precision-recall plot for classifiers of DE-G pairs shown in a. Positive DE-G pairs are those where perturbation of the distal element significantly decreases expression of the gene. Curves represent the performance for predicting significant decreases in expression for DE-G pairs based on thresholds on the ABC score (red) and genomic distance between the DE and the TSS of the gene (black). Circles represent the performance of models that predict significant regulation for DE-G pairs based on various criteria: pair lies within 100 kb (black), and DEs are assigned to regulate the nearest expressed gene (grey). c, Comparison of observed and predicted DE-G connections in the SORT1 locus (chr1:109714926–109989926). Predicted DE-G connections (dotted red arcs) are based on ABC maps in primary human liver tissue. Observed DE-G connections (solid red arcs) are from previous experiments in which CRISPR was used to introduce indels near rs12740374 in primary hepatocytes and an eQTL study in human liver.

Comment in

References

    1. Maurano MT et al. Systematic localization of common disease-associated variation in regulatory DNA. Science 337, 1190–5 (2012). - PMC - PubMed
    1. Visel A, Rubin EM & Pennacchio LA Genomic views of distant-acting enhancers. Nature 461, 199–205 (2009). - PMC - PubMed
    1. Spitz F & Furlong EE Transcription factors: from enhancer binding to developmental control. Nat Rev Genet 13, 613–26 (2012). - PubMed
    1. Shlyueva D, Stampfel G & Stark A Transcriptional enhancers: from properties to genome-wide predictions. Nat Rev Genet 15, 272–86 (2014). - PubMed
    1. van Arensbergen J, van Steensel B & Bussemaker HJ In search of the determinants of enhancer-promoter interaction specificity. Trends Cell Biol 24, 695–702 (2014). - PMC - PubMed

Methods-only references

    1. Hsu PD et al. DNA targeting specificity of RNA-guided Cas9 nucleases. Nat Biotechnol 31, 827–32 (2013). - PMC - PubMed
    1. ENCODE Project Consortium. An integrated encyclopedia of DNA elements in the human genome. Nature 489, 57–74 (2012). - PMC - PubMed
    1. Amemiya HM, Kundaje A & Boyle AP The ENCODE Blacklist: identification of problematic regions of the genome. Sci Rep 9, 9354 (2019). - PMC - PubMed
    1. Gross DS & Garrard WT Nuclease hypersensitive sites in chromatin. Annu Rev Biochem 57, 159–97 (1988). - PubMed
    1. Rada-Iglesias A et al. A unique chromatin signature uncovers early developmental enhancers in humans. Nature 470, 279–83 (2011). - PMC - PubMed

Publication types