Expression profiling of single cells and patient cohorts identifies multiple immunosuppressive pathways and an altered NK cell phenotype in glioblastoma
- PMID: 31784984
- PMCID: PMC7066386
- DOI: 10.1111/cei.13403
Expression profiling of single cells and patient cohorts identifies multiple immunosuppressive pathways and an altered NK cell phenotype in glioblastoma
Abstract
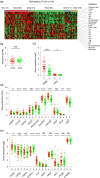
Glioblastoma (GBM) is an aggressive cancer with a very poor prognosis. Generally viewed as weakly immunogenic, GBM responds poorly to current immunotherapies. To understand this problem more clearly we used a combination of natural killer (NK) cell functional assays together with gene and protein expression profiling to define the NK cell response to GBM and explore immunosuppression in the GBM microenvironment. In addition, we used transcriptome data from patient cohorts to classify GBM according to immunological profiles. We show that glioma stem-like cells, a source of post-treatment tumour recurrence, express multiple immunomodulatory cell surface molecules and are targeted in preference to normal neural progenitor cells by natural killer (NK) cells ex vivo. In contrast, GBM-infiltrating NK cells express reduced levels of activation receptors within the tumour microenvironment, with hallmarks of transforming growth factor (TGF)-β-mediated inhibition. This NK cell inhibition is accompanied by expression of multiple immune checkpoint molecules on T cells. Single-cell transcriptomics demonstrated that both tumour and haematopoietic-derived cells in GBM express multiple, diverse mediators of immune evasion. Despite this, immunome analysis across a patient cohort identifies a spectrum of immunological activity in GBM, with active immunity marked by co-expression of immune effector molecules and feedback inhibitory mechanisms. Our data show that GBM is recognized by the immune system but that anti-tumour immunity is restrained by multiple immunosuppressive pathways, some of which operate in the healthy brain. The presence of immune activity in a subset of patients suggests that these patients will more probably benefit from combination immunotherapies directed against multiple immunosuppressive pathways.
Keywords: NK cells; glioblastoma; immune-inhibition.
© 2019 The Authors. Clinical & Experimental Immunology published by John Wiley & Sons Ltd on behalf of British Society for Immunology.
Conflict of interest statement
The authors declare that they have no competing interests.
Figures


Similar articles
-
Resistance to cytotoxicity and sustained release of interleukin-6 and interleukin-8 in the presence of decreased interferon-γ after differentiation of glioblastoma by human natural killer cells.Cancer Immunol Immunother. 2016 Sep;65(9):1085-97. doi: 10.1007/s00262-016-1866-x. Epub 2016 Jul 20. Cancer Immunol Immunother. 2016. PMID: 27439500 Free PMC article.
-
Characterization of HIF-1α Knockout Primary Human Natural Killer Cells Including Populations in Allogeneic Glioblastoma.Int J Mol Sci. 2024 May 28;25(11):5896. doi: 10.3390/ijms25115896. Int J Mol Sci. 2024. PMID: 38892084 Free PMC article.
-
Single-cell transcriptomics reveals immunosuppressive microenvironment and highlights tumor-promoting macrophage cells in Glioblastoma.PLoS One. 2025 Apr 7;20(4):e0312764. doi: 10.1371/journal.pone.0312764. eCollection 2025. PLoS One. 2025. PMID: 40193323 Free PMC article.
-
Molecular Heterogeneity and Immunosuppressive Microenvironment in Glioblastoma.Front Immunol. 2020 Jul 17;11:1402. doi: 10.3389/fimmu.2020.01402. eCollection 2020. Front Immunol. 2020. PMID: 32765498 Free PMC article. Review.
-
Killing the killers: Natural killer cell therapy targeting glioma stem cells in high-grade glioma.Mol Ther. 2025 Jun 4;33(6):2462-2478. doi: 10.1016/j.ymthe.2025.02.043. Epub 2025 Mar 3. Mol Ther. 2025. PMID: 40040281 Review.
Cited by
-
Evaluation of Comprehensive Gene Expression and NK Cell-Mediated Killing in Glioblastoma Cell Line-Derived Spheroids.Cancers (Basel). 2021 Sep 29;13(19):4896. doi: 10.3390/cancers13194896. Cancers (Basel). 2021. PMID: 34638384 Free PMC article.
-
Overcoming Resistance to Checkpoint Inhibitors: Natural Killer Cells in Non-Small Cell Lung Cancer.Front Oncol. 2022 May 31;12:886440. doi: 10.3389/fonc.2022.886440. eCollection 2022. Front Oncol. 2022. PMID: 35712510 Free PMC article. Review.
-
Characterization of gene cluster heterogeneity in single-cell transcriptomic data within and across cancer types.Biol Open. 2022 Jun 15;11(6):bio059256. doi: 10.1242/bio.059256. Epub 2022 Jun 23. Biol Open. 2022. PMID: 35665803 Free PMC article.
-
Tumor-associated monocytes promote mesenchymal transformation through EGFR signaling in glioma.Cell Rep Med. 2023 Sep 19;4(9):101177. doi: 10.1016/j.xcrm.2023.101177. Epub 2023 Aug 30. Cell Rep Med. 2023. PMID: 37652019 Free PMC article.
-
Research Progress of NK Cells in Glioblastoma Treatment.Onco Targets Ther. 2025 Jan 18;18:87-106. doi: 10.2147/OTT.S486411. eCollection 2025. Onco Targets Ther. 2025. PMID: 39845286 Free PMC article. Review.
References
Publication types
MeSH terms
Grants and funding
LinkOut - more resources
Full Text Sources
Medical

