. 2020 May;72(5):714-725.
doi: 10.1002/art.41184. Epub 2020 Mar 17.

B Cell Synovitis and Clinical Phenotypes in Rheumatoid Arthritis: Relationship to Disease Stages and Drug Exposure

Collaborators, Affiliations

B Cell Synovitis and Clinical Phenotypes in Rheumatoid Arthritis: Relationship to Disease Stages and Drug Exposure

F Rivellese et al. Arthritis Rheumatol. 2020 May.

Abstract

Objective: To define the relationship of synovial B cells to clinical phenotypes at different stages of disease evolution and drug exposure in rheumatoid arthritis (RA).

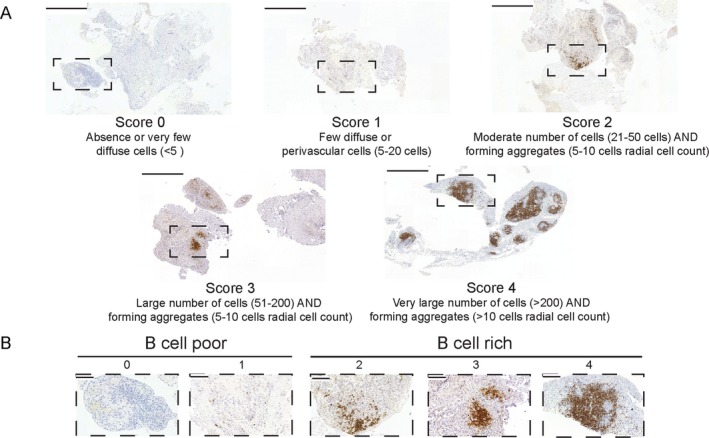
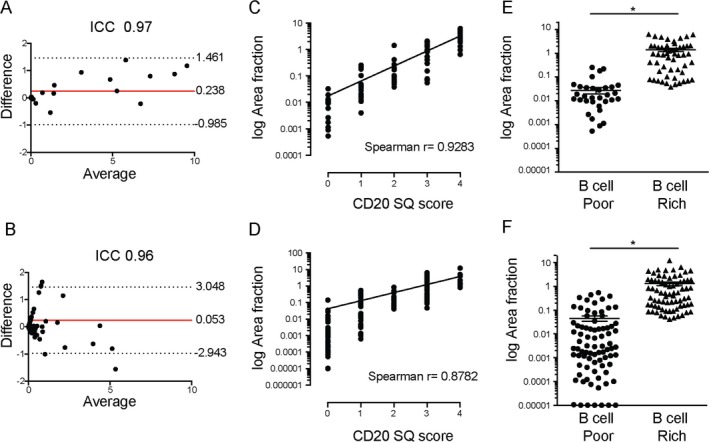
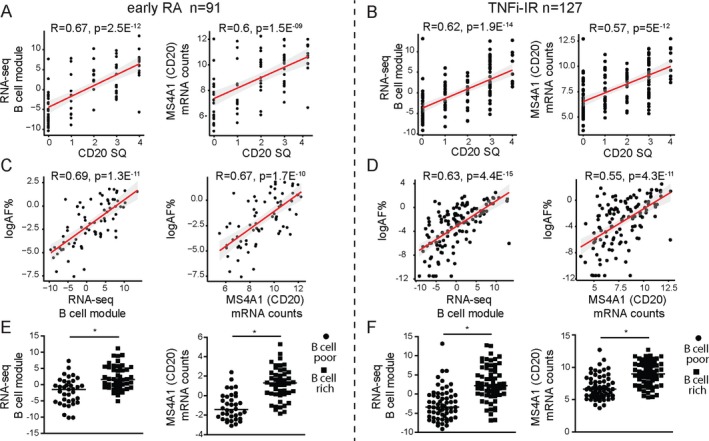
Methods: Synovial biopsy specimens and demographic and clinical data were collected from 2 RA cohorts (n = 329), one of patients with untreated early RA (n = 165) and one of patients with established RA with an inadequate response to tumor necrosis factor inhibitors (TNFi-IR; n = 164). Synovial tissue was subjected to hematoxylin and eosin and immunohistochemical staining and semiquantitative assessment for the degree of synovitis (on a scale of 0-9) and of CD20+ B cell infiltrate (on a scale of 0-4). B cell scores were validated by digital image analysis and B cell lineage-specific transcript analysis (RNA-Seq) in the early RA (n = 91) and TNFi-IR (n = 127) cohorts. Semiquantitative CD20 scores were used to classify patients as B cell rich (≥2) or B cell poor (<2).

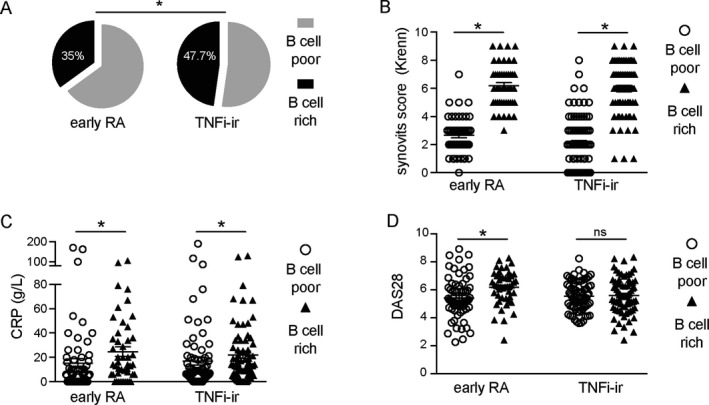
Results: Semiquantitative B cell scores correlated with digital image analysis quantitative measurements and B cell lineage-specific transcripts. B cell-rich synovitis was present in 35% of patients in the early RA cohort and 47.7% of patients in the TNFi-IR cohort (P = 0.025). B cell-rich patients showed higher levels of disease activity and seropositivity for rheumatoid factor and anti-citrullinated protein antibody in early RA but not in established RA, while significantly higher histologic synovitis scores in B cell-rich patients were demonstrated in both cohorts.

Conclusion: We describe a robust semiquantitative histologic B cell score that closely replicates the quantification of B cells by digital or molecular analyses. Our findings indicate an ongoing B cell-rich synovitis, which does not seem to be captured by standard clinimetric assessment, in a larger proportion of patients with established RA than early RA.


Figures

Figure 1
Figure 1
B cell scoring. A, Representative images for each semiquantitative CD20 immunohistochemical score in patients with rheumatoid arthritis with an inadequate response to tumor necrosis factor inhibitors. Bars = 500 μm. B, Higher‐magnification views of the boxed areas in A. Bars = 100 μm.
Figure 2
Figure 2
Semiquantitative (SQ) B cell scores and digital image analysis. A and B, Bland‐Altman plots showing the difference between and average of 2 measurements of CD20+ B cell area fraction (percent of stained area, calculated as total stained area/total tissue area × 100) in the cohort of patients with early rheumatoid arthritis (RA; n = 15) (A) and in the cohort of patients with established RA with an inadequate response to tumor necrosis factor inhibitors (TNFi‐IR; n = 100) (B), obtained by 2 independent observers in 2 different centers (Queen Mary University of London and University of Pavia). Solid lines indicate the mean; dotted lines indicate the 95% confidence interval. ICC = intraclass correlation coefficient. C and D, Correlation between semiquantitative CD20+ B cell score and CD20+ B cell area fraction in the early RA cohort (n = 91) (C) and the TNFi‐IR cohort (n = 155) (D). E and F, CD20+ B cell area fraction in the early RA cohort (n = 91) (E) and the TNFi‐IR cohort (n = 155) (F) classified as B cell poor or B cell rich. Symbols represent individual patients; horizontal lines and error bars show the mean ± SD. * = P < 0.05 by Mann‐Whitney test. Color figure can be viewed in the online issue, which is available at http://onlinelibrary.wiley.com/doi/10.1002/art.41184/abstract.
Figure 3
Figure 3
Correlation of semiquantitative (SQ) B cell scores with RNA‐Seq B cell module scores. A and B, Correlations between the semiquantitative CD20+ B cell score and the RNA‐Seq B cell module and between the semiquantitative CD20+ B cell score and CD20/MS4A1 gene expression levels in the cohort of patients with early rheumatoid arthritis (RA) (A) and the cohort of patients with established RA with an inadequate response to tumor necrosis factor inhibitors (TNFi‐IR) (B). C and D, Correlations between the CD20+ B cell area fraction (AF) (percent of stained area, calculated as total stained area/total tissue area × 100) and the RNA‐Seq B cell module and between the CD20+ B cell area fraction and CD20/MS4A1 gene expression levels in the early RA cohort (C) and the TNFi‐IR cohort (D). In AD, symbols represent individual patients (n = 91 for early RA and 127 for TNFi‐IR); Lines and shading indicate the regression line and 95% confidence interval. E and F, RNA‐Seq B cell module and CD20/MS4A1 gene expression levels in B cell–poor and B cell–rich patients in the early RA cohort (n = 91) (E) and TNFi‐IR cohort (n = 127) (F). Symbols represent individual patients; horizontal lines show the mean. * = P < 0.05 by Mann‐Whitney test. Color figure can be viewed in the online issue, which is available at http://onlinelibrary.wiley.com/doi/10.1002/art.41184/abstract.
Figure 4
Figure 4
B cell–rich synovitis at different rheumatoid arthritis (RA) disease stages. A, Prevalence of B cell–rich synovitis in the cohort of patients with early RA and in the cohort of patients with established RA with an inadequate response to tumor necrosis factor inhibitors (TNFi‐IR). BD, Krenn synovitis score (B), C‐reactive protein (CRP) level (C), and Disease Activity Score in 28 joints (DAS28) using the erythrocyte sedimentation rate (D) in B cell–poor and B cell–rich patients in the early RA cohort and the TNFi‐IR cohort. Symbols represent individual patients (n = 143 for early RA and 155 for TNFi‐IR); horizontal lines and error bars show the median and interquartile range in B and the mean ± SD in C and D. * = P < 0.05 by chi‐square test in A; by Mann‐Whitney test in BD. NS = not significant.

Comment in

References

    1. Edwards JC, Szczepański L, Szechiński J, Filipowicz‐Sosnowska A, Emery P, Close DR, et al. Efficacy of B‐cell–targeted therapy with rituximab in patients with rheumatoid arthritis. N Engl J Med 2004;350:2572–81. - PubMed
    1. Kramm H, Hansen KE, Gowing E, Bridges A. Successful therapy of rheumatoid arthritis with rituximab: renewed interest in the role of B cells in the pathogenesis of rheumatoid arthritis. J Clin Rheumatol 2004;10:28–32. - PubMed
    1. Humby F, Bombardieri M, Manzo A, Kelly S, Blades MC, Kirkham B, et al. Ectopic lymphoid structures support ongoing production of class‐switched autoantibodies in rheumatoid synovium. PLoS Med 2009;6:e1. - PMC - PubMed
    1. Rosengren S, Wei N, Kalunian KC, Zvaifler NJ, Kavanaugh A, Boyle DL. Elevated autoantibody content in rheumatoid arthritis synovia with lymphoid aggregates and the effect of rituximab. Arthritis Res Ther 2008;10:R105. - PMC - PubMed
    1. Yeo L, Toellner KM, Salmon M, Filer A, Buckley CD, Raza K, et al. Cytokine mRNA profiling identifies B cells as a major source of RANKL in rheumatoid arthritis. Ann Rheum Dis 2011;70:2022–8. - PMC - PubMed

Publication types