. 2019 Dec 5;105(6):1274-1285.
doi: 10.1016/j.ajhg.2019.11.003. Epub 2019 Nov 27.

Sex-Based Analysis of De Novo Variants in Neurodevelopmental Disorders

Affiliations

Sex-Based Analysis of De Novo Variants in Neurodevelopmental Disorders

Tychele N Turner et al. Am J Hum Genet. .

Abstract

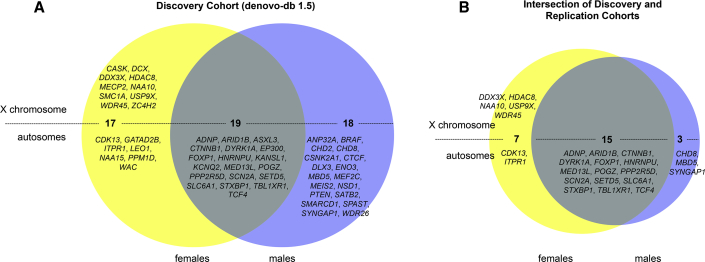
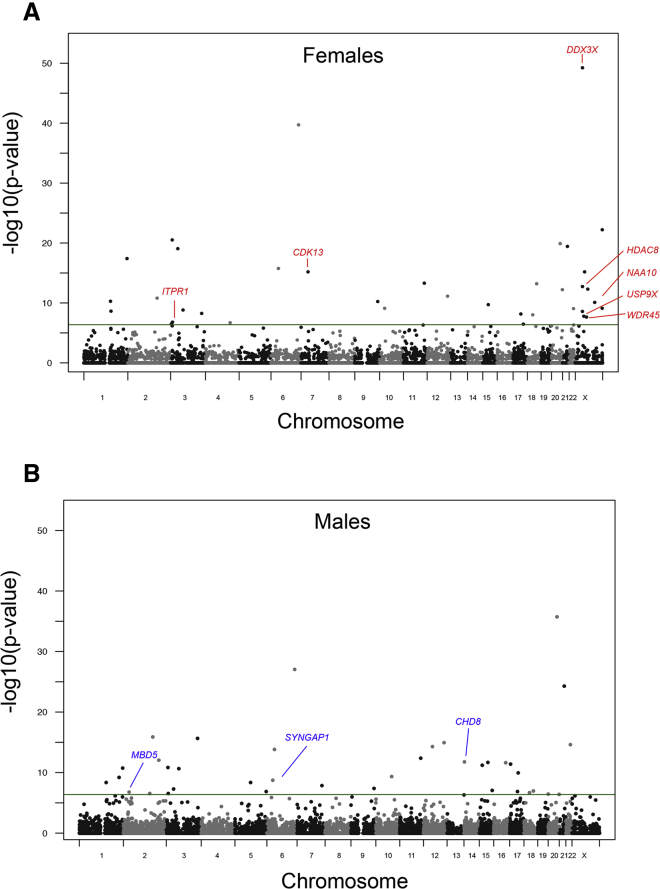
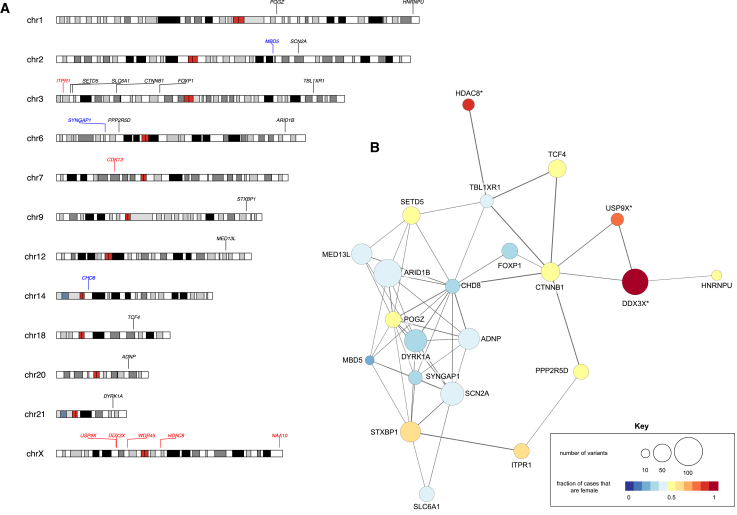
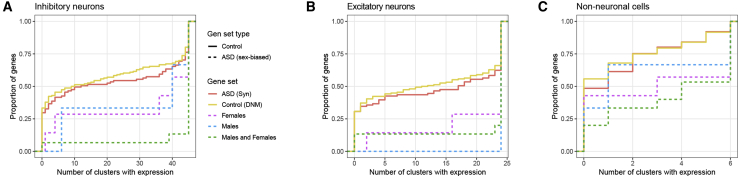
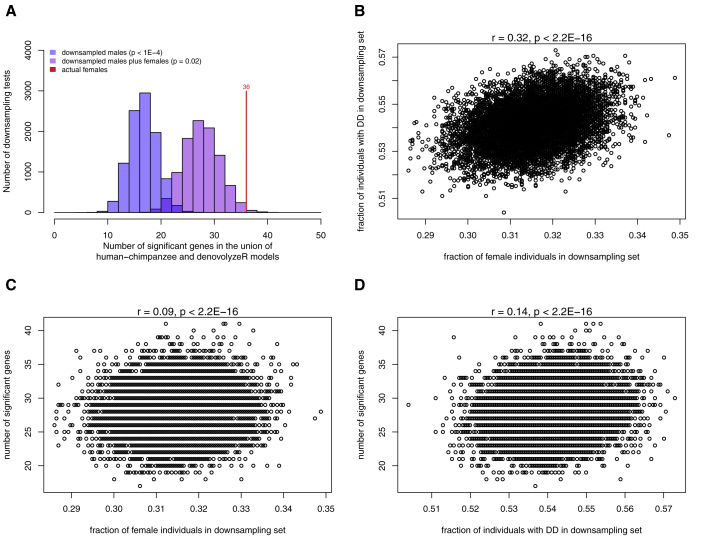
While genes with an excess of de novo mutations (DNMs) have been identified in children with neurodevelopmental disorders (NDDs), few studies focus on DNM patterns where the sex of affected children is examined separately. We considered ∼8,825 sequenced parent-child trios (n ∼26,475 individuals) and identify 54 genes with a DNM enrichment in males (n = 18), females (n = 17), or overlapping in both the male and female subsets (n = 19). A replication cohort of 18,778 sequenced parent-child trios (n = 56,334 individuals) confirms 25 genes (n = 3 in males, n = 7 in females, n = 15 in both male and female subsets). As expected, we observe significant enrichment on the X chromosome for females but also find autosomal genes with potential sex bias (females, CDK13, ITPR1; males, CHD8, MBD5, SYNGAP1); 6.5% of females harbor a DNM in a female-enriched gene, whereas 2.7% of males have a DNM in a male-enriched gene. Sex-biased genes are enriched in transcriptional processes and chromatin binding, primarily reside in the nucleus of cells, and have brain expression. By downsampling, we find that DNM gene discovery is greatest when studying affected females. Finally, directly comparing de novo allele counts in NDD-affected males and females identifies one replicated genome-wide significant gene (DDX3X) with locus-specific enrichment in females. Our sex-based DNM enrichment analysis identifies candidate NDD genes differentially affecting males and females and indicates that the study of females with NDDs leads to greater gene discovery consistent with the female-protective effect.

Keywords: X chromosome; autism; female protective effect; intellectual disability; neurodevelopmental disorder; sex bias.


Conflict of interest statement

E.E.E. is on the scientific advisory board (SAB) of DNAnexus, Inc. Z.Z., R.I.T., and K.R. are employed by GeneDx. K.R. is a shareholder of OPKO.

Figures

Figure 1
Figure 1
Genes Significant by DNM by Sex (A) Discovery cohort results show genes reaching DNM genome-wide significance in females only (n = 17, yellow), males only (n = 18, blue), or both sexes (n = 19, gray). (B) Replication cohort: while 46 genes remained significant post-replication, only 25 are significant by their original classification. The Venn diagrams are split to show the genes on the X chromosome (above the line) and those on the autosomes (below). The genes significant for de novo variants were from the union of the CH and denovolyzeR methods.
Figure 2
Figure 2
Sex-Biased DNM Enrichment Manhattan plots for de novo testing in (A) females and (B) males. Shown are the minimum p values from the discovery cohort analyses. Labeled are all genes with replicated significance in females only or males only, respectively. Unlabeled significant enrichments represent those shared between sexes and those that were not significant in the replication cohort.
Figure 3
Figure 3
Genomic Location and Protein-Protein Interaction Analysis of Significant Genes (A) Replicated, significant genes are labeled at their genomic coordinate with genes in black as significant in both males and females, in blue significant in males only, and in red significant in females only. (B) STRING protein-protein interaction network highlighting genes enriched for DNMs in females and/or males. The size of the circle corresponds to the number of mutations and the shading corresponds to the number of variants that are female (100% = red) or male (100% = blue) with shades in between based on the amount that are male or female. This network is shown to emphasize the high amount of interaction, at the protein level, between the genes surviving replication; 22 of the 25 genes surviving replication are within this same network. It also provides a visualization of proportionally how many of the variants are coming from females or males. Asterisk () next to the protein name indicates the gene is on the X chromosome. Note: (B) includes data from both the discovery and replication sets.
Figure 4
Figure 4
Sex-Biased NDD Risk Genes Show Significant Pan-neuronal Enrichment in Human Cortex Empirical cumulative distributions of the number of cell type clusters recently identified in human cortex that express (CPM > 1 in > 50% of nuclei) replicated sex-biased NDD genes versus control genes for three broad classes of cells: (A) inhibitory neurons, (B) excitatory neurons, and (C) non-neuronal cells. (A) 87% of NDD risk genes shared by males and females are expressed in all 45 types of inhibitory neurons while only 20% of control genes are expressed in all types. This enrichment in inhibitory types is statistically significant based on a Wilcoxon rank sum test (Bonferroni-corrected p = 9.6 × 10−5). (B) More than two-thirds of male- and female-biased NDD risk genes and 80% of male- and female-shared risk genes are expressed in all 25 excitatory neuron types, which is significantly (Bonferroni-corrected p = 0.022) more than 34% of control genes. (C) Approximately one-third of sex-biased risk genes are expressed in all six non-neuronal cell types compared to 10% of control genes, and risk genes shared by both males and females show statistically significant (Bonferroni-corrected p = 0.0059) enrichment compared to control genes.
Figure 5
Figure 5
Results of Downsampling Experiments (A) Shown are the number of genes significant in each downsampling test from the discovery cohort. In blue are those from downsamplings consisting of males only and in purple are downsamplings from males and females. The red line indicates the actual result of the female set. (B) Fraction of individuals with DD versus the fraction of females in each downsampling set. (C) Number of significant genes versus the fraction of females in each downsampling set. (D) Number of significant genes versus the fraction of individuals in the discovery cohort with DD. Above the plots for (B), (C), and (D) are the results of the correlation test.

References

    1. Ober C., Loisel D.A., Gilad Y. Sex-specific genetic architecture of human disease. Nat. Rev. Genet. 2008;9:911–922. - PMC - PubMed
    1. American Psychiatric Association. Kennedy P.J. American Psychiatric Publishing; Washington, DC: 2015. Understanding Mental Disorders: Your Guide to DSM-5. - PubMed
    1. Fombonne E. Epidemiological surveys of autism and other pervasive developmental disorders: an update. J. Autism Dev. Disord. 2003;33:365–382. - PubMed
    1. Piton A., Redin C., Mandel J.L. XLID-causing mutations and associated genes challenged in light of data from large-scale human exome sequencing. Am. J. Hum. Genet. 2013;93:368–383. - PMC - PubMed
    1. Werling D.M., Geschwind D.H. Sex differences in autism spectrum disorders. Curr. Opin. Neurol. 2013;26:146–153. - PMC - PubMed

Publication types

Substances