Brain and blood metabolome for Alzheimer's dementia: findings from a targeted metabolomics analysis
- PMID: 31785839
- PMCID: PMC6995427
- DOI: 10.1016/j.neurobiolaging.2019.10.014
Brain and blood metabolome for Alzheimer's dementia: findings from a targeted metabolomics analysis
Erratum in
-
Corrigendum to brain and blood metabolome for Alzheimer's dementia: findings from a targeted metabolomics analysis [Neurobiology of Aging Volume 86, February 2020, Pages 123-133].Neurobiol Aging. 2020 Jul;91:169. doi: 10.1016/j.neurobiolaging.2020.04.004. Epub 2020 Apr 18. Neurobiol Aging. 2020. PMID: 32312579 Free PMC article. No abstract available.
Abstract
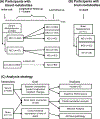
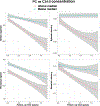
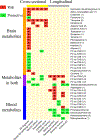
The development of Alzheimer's dementia (AD) accompanies both central and peripheral metabolic disturbance, but the metabolic basis underlying AD and metabolic markers predictive of AD risk remain to be determined. It is also unclear whether the metabolic changes in the peripheral blood and brain are overlapping in relation to AD. The present study addresses these questions by targeted metabolomics in both antemortem blood and postmortem brain samples in 2 community-based longitudinal cohorts of aging and dementia. We found that higher serum levels of 3 acylcarnitines, including decanoylcarnitine (C10), pimelylcarnitine (C7-DC), and tetradecadienylcarnitine (C14:2), significantly predict a lower risk of incident AD (composite hazard ratio = 0.368, 95% CI [0.207, 0.653]) after an average of 4.5-year follow-up, independent of age, sex, and education. In addition, baseline serum levels of ten glycerophospholipids, one amino acid, and 5 acylcarnitines predict the longitudinal change in cognitive functions. Moreover, 28 brain metabolites were associated with AD phenotypes. Of the putative metabolites identified in the serum and brain, 4 metabolites (3 glycerophospholipids [PC aa C30:0, PC ae C34:0, PC ae C36:1] and 1 acylcarnitine [C14:2]) were present in both the postmortem brain and antemortem blood, but only one metabolite (C14:2) was associated with AD in the same direction (i.e., protective). Partial correlation and network analyses suggest a potential tissue-specific regulation of metabolism, although other alternatives exist. Together, we identified significant associations of both central and peripheral metabolites with AD phenotypes, but there seems to be little overlap between the 2 tissues.
Keywords: AD neuropathology; Alzheimer's dementia; Cognitive decline; Postmortem brain metabolomics; Targeted metabolomics.
Copyright © 2019 Elsevier Inc. All rights reserved.
Conflict of interest statement
Figures


Similar articles
-
Brain and blood metabolite signatures of pathology and progression in Alzheimer disease: A targeted metabolomics study.PLoS Med. 2018 Jan 25;15(1):e1002482. doi: 10.1371/journal.pmed.1002482. eCollection 2018 Jan. PLoS Med. 2018. PMID: 29370177 Free PMC article.
-
Targeted Metabolomic Analysis of Soluble Lysates from Platelets of Patients with Mild Cognitive Impairment and Alzheimer's Disease Compared to Healthy Controls: Is PC aeC40:4 a Promising Diagnostic Tool?J Alzheimers Dis. 2017;57(2):493-504. doi: 10.3233/JAD-160172. J Alzheimers Dis. 2017. PMID: 28269764
-
Systemic and central nervous system metabolic alterations in Alzheimer's disease.Alzheimers Res Ther. 2019 Nov 28;11(1):93. doi: 10.1186/s13195-019-0551-7. Alzheimers Res Ther. 2019. PMID: 31779690 Free PMC article.
-
Metabolomic Alterations in the Blood and Brain in Association with Alzheimer's Disease: Evidence from in vivo to Clinical Studies.J Alzheimers Dis. 2021;84(1):23-50. doi: 10.3233/JAD-210737. J Alzheimers Dis. 2021. PMID: 34511504 Review.
-
Tracking the potential involvement of metabolic disease in Alzheimer's disease-Biomarkers and beyond.Int Rev Neurobiol. 2020;154:51-77. doi: 10.1016/bs.irn.2020.03.014. Epub 2020 Jul 10. Int Rev Neurobiol. 2020. PMID: 32739014 Review.
Cited by
-
Metabolism-Based Gene Differences in Neurons Expressing Hyperphosphorylated AT8- Positive (AT8+) Tau in Alzheimer's Disease.ASN Neuro. 2021 Jan-Dec;13:17590914211019443. doi: 10.1177/17590914211019443. ASN Neuro. 2021. PMID: 34121475 Free PMC article.
-
Multi-Omic Blood Biomarkers as Dynamic Risk Predictors in Late-Onset Alzheimer's Disease.Int J Mol Sci. 2024 Jan 19;25(2):1231. doi: 10.3390/ijms25021231. Int J Mol Sci. 2024. PMID: 38279230 Free PMC article. Review.
-
Microbiome and Metabolome Insights into the Role of the Gastrointestinal-Brain Axis in Parkinson's and Alzheimer's Disease: Unveiling Potential Therapeutic Targets.Metabolites. 2022 Dec 5;12(12):1222. doi: 10.3390/metabo12121222. Metabolites. 2022. PMID: 36557259 Free PMC article. Review.
-
Plasma Lyso-PE 22:6 and Lyso-PE 20:4 are associated with development of mild to moderate depression revealed by metabolomics: a pilot study.BMC Psychiatry. 2025 Jul 1;25(1):597. doi: 10.1186/s12888-025-07051-4. BMC Psychiatry. 2025. PMID: 40597055 Free PMC article.
-
Comprehensive metabolomics and lipidomics profiling uncovering neuroprotective effects of Ginkgo biloba L. leaf extract on Alzheimer's disease.Front Pharmacol. 2022 Dec 21;13:1076960. doi: 10.3389/fphar.2022.1076960. eCollection 2022. Front Pharmacol. 2022. PMID: 36618950 Free PMC article.
References
-
- Clarke JR, Ribeiro FC, Frozza RL, De Felice FG, Lourenco M V. Metabolic dysfunction in Alzheimer’s disease: from basic neurobiology to clinical approaches. J Alzheimer’s Dis 2018:1–22. - PubMed
-
- Rochfort S Metabolomics reviewed: a new “omics” platform technology for systems biology and implications for natural products research. J Nat Prod 2005;68:1813–20. - PubMed
-
- Harrigan GG, Goodacre R. Metabolic profiling: its role in biomarker discovery and gene function analysis. Springer Science & Business Media; 2012.
-
- van der Lee SJ, Teunissen CE, Pool R, Shipley MJ, Teumer A, Chouraki V, et al. Circulating metabolites and general cognitive ability and dementia: Evidence from 11 cohort studies. Alzheimer’s Dement 2018;14:707–22. - PubMed
-
- Proitsi P, Kim M, Whiley L, Simmons A, Sattlecker M, Velayudhan L, et al. Association of blood lipids with Alzheimer’s disease: A comprehensive lipidomics analysis. Alzheimer’s Dement 2017;13:140–51. - PubMed
Publication types
MeSH terms
Substances
Grants and funding
- R01 AG042210/AG/NIA NIH HHS/United States
- RF1 AG051550/AG/NIA NIH HHS/United States
- RF1 AG052476/AG/NIA NIH HHS/United States
- R01 AG017917/AG/NIA NIH HHS/United States
- P30 AG010161/AG/NIA NIH HHS/United States
- RF1 AG059093/AG/NIA NIH HHS/United States
- RF1 AG058942/AG/NIA NIH HHS/United States
- RF1 AG036042/AG/NIA NIH HHS/United States
- U01 AG046152/AG/NIA NIH HHS/United States
- U01 AG061359/AG/NIA NIH HHS/United States
- R01 AG046171/AG/NIA NIH HHS/United States
- RF1 AG057452/AG/NIA NIH HHS/United States
- R01 DK107532/DK/NIDDK NIH HHS/United States
- R01 AG036836/AG/NIA NIH HHS/United States
- R01 AG015819/AG/NIA NIH HHS/United States
LinkOut - more resources
Full Text Sources
Medical
Miscellaneous

