. 2020 Jan 22;105(2):276-292.e5.
doi: 10.1016/j.neuron.2019.10.009. Epub 2019 Nov 27.

Rewiring Neuronal Glycerolipid Metabolism Determines the Extent of Axon Regeneration

Affiliations

Rewiring Neuronal Glycerolipid Metabolism Determines the Extent of Axon Regeneration

Chao Yang et al. Neuron. .

Abstract

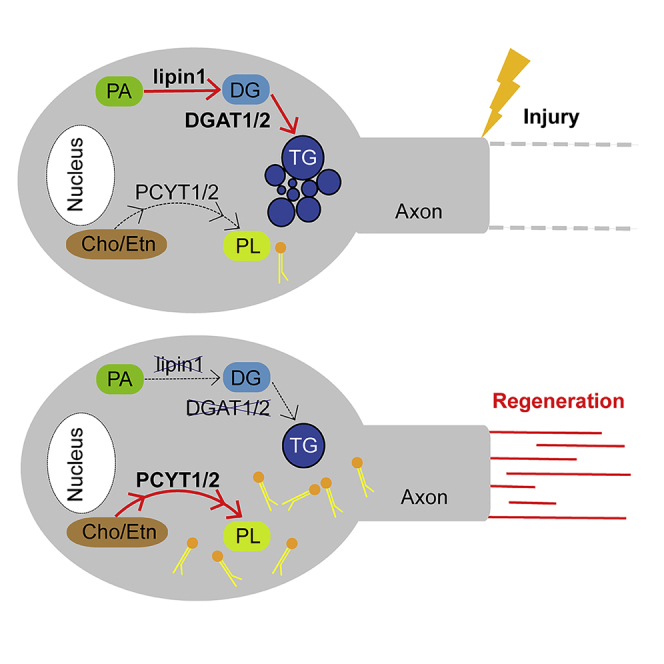
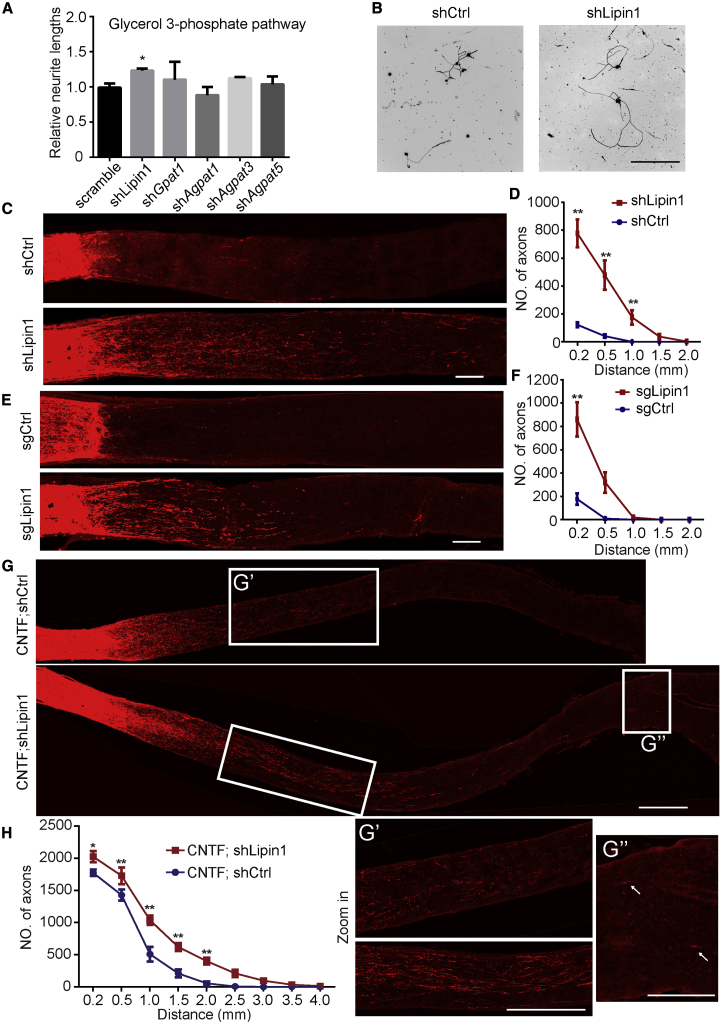
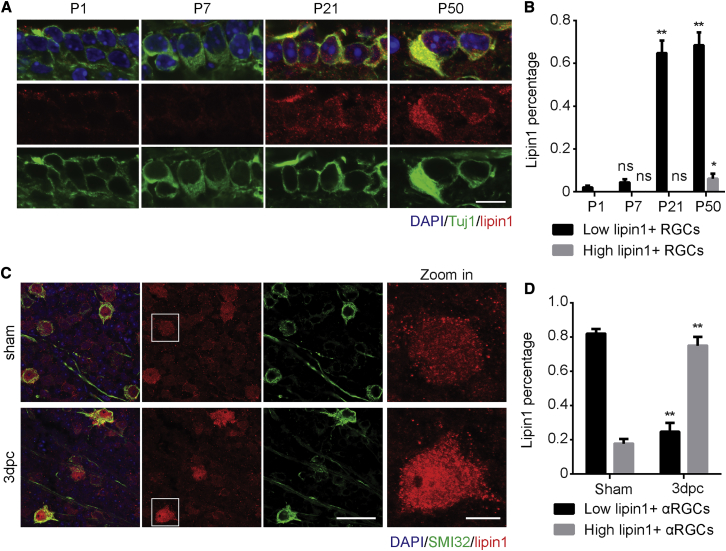
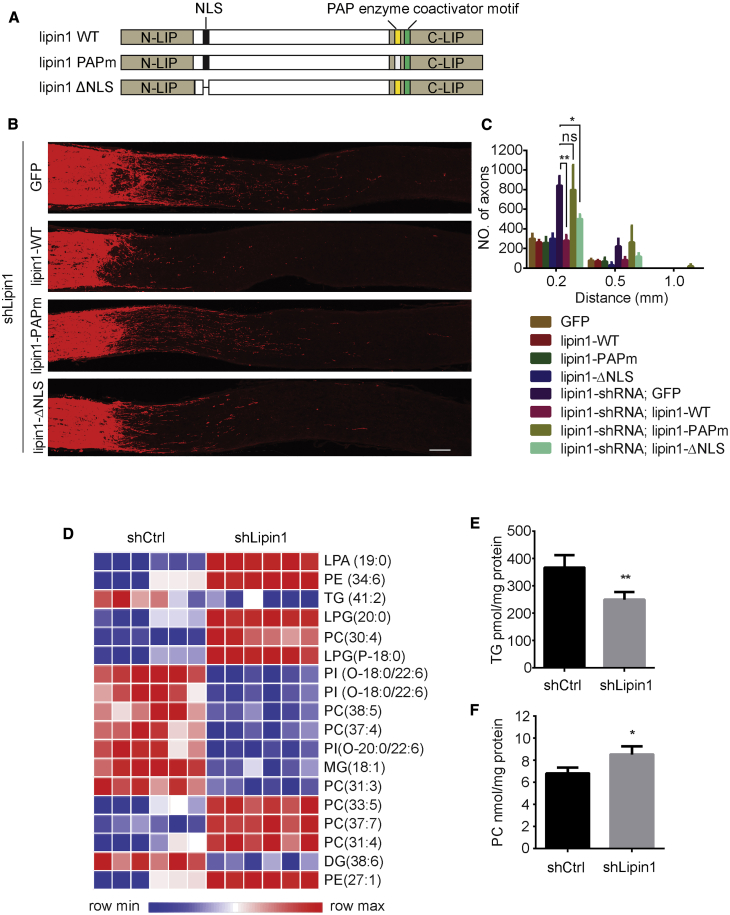
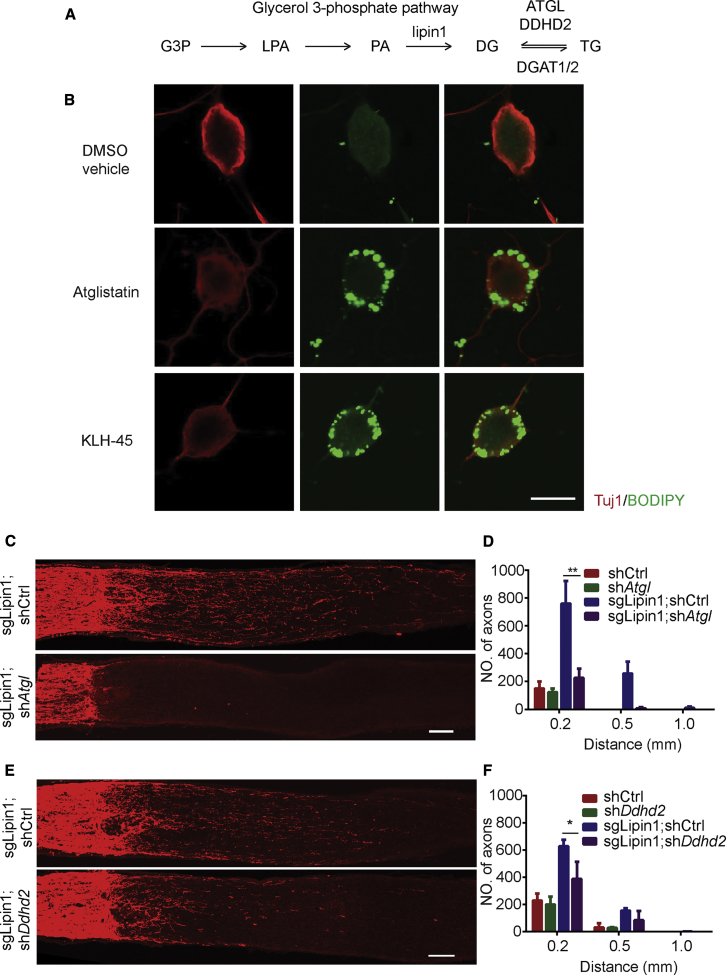
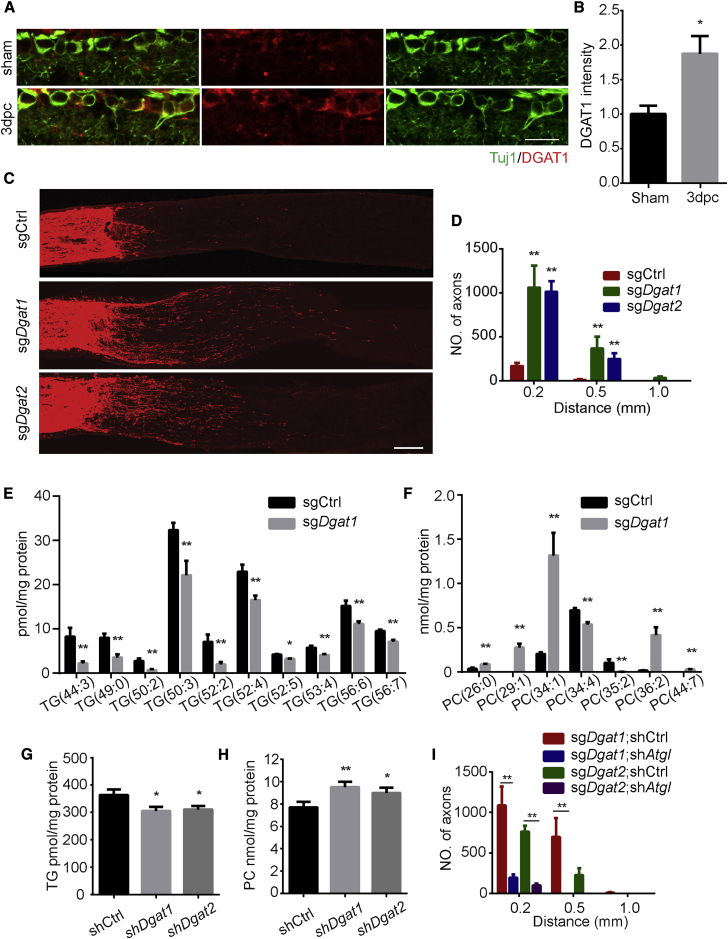
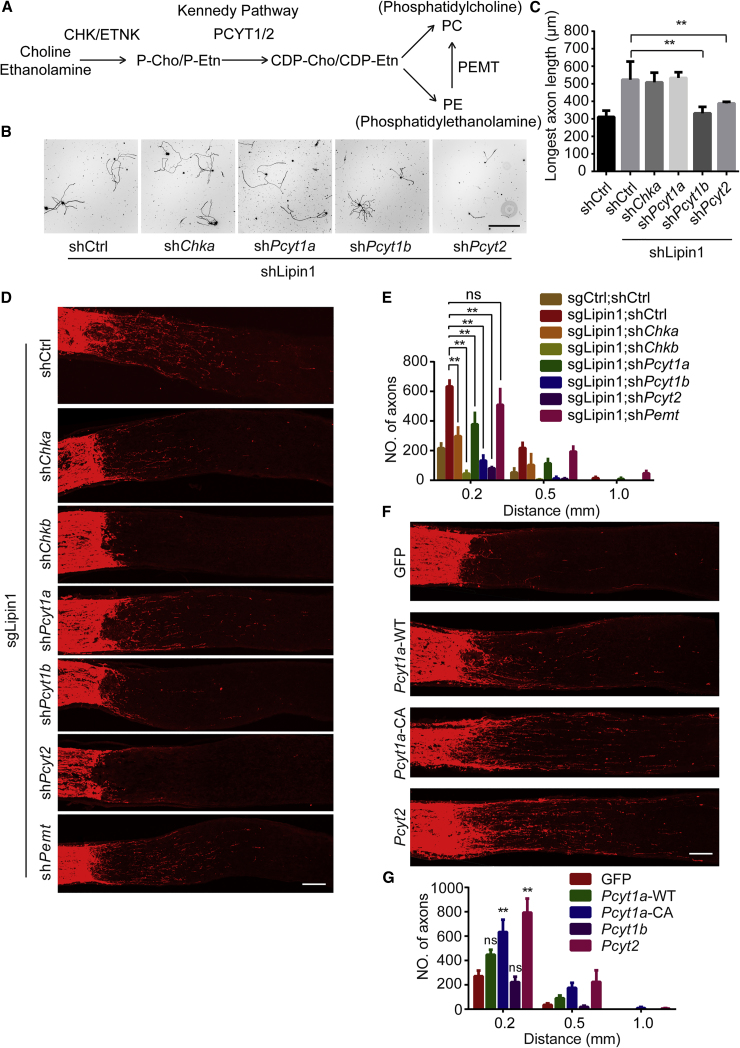
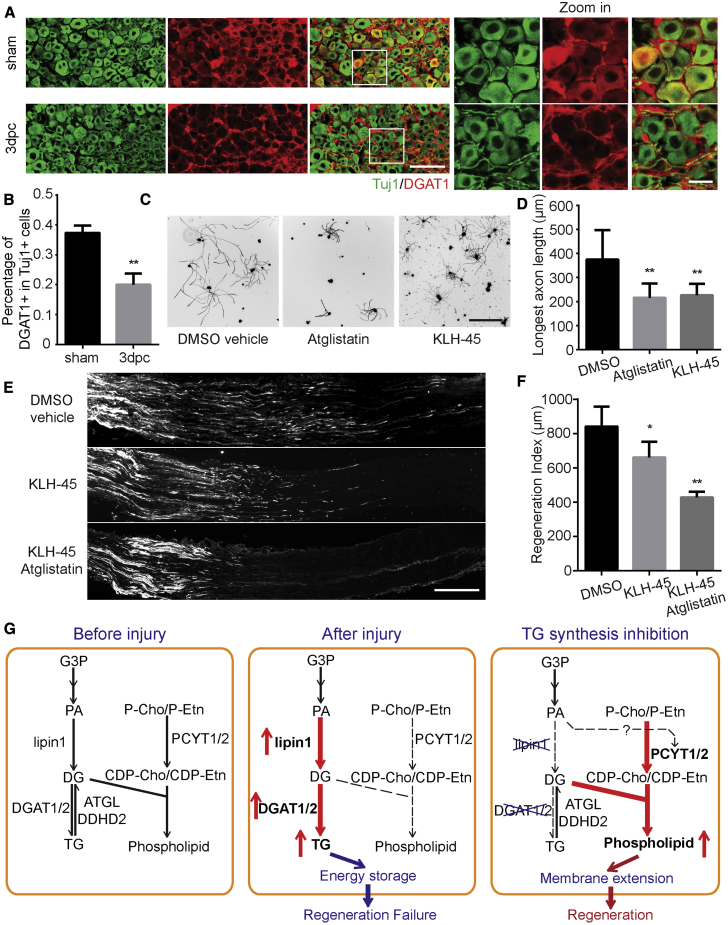
How adult neurons coordinate lipid metabolism to regenerate axons remains elusive. We found that depleting neuronal lipin1, a key enzyme controlling the balanced synthesis of glycerolipids through the glycerol phosphate pathway, enhanced axon regeneration after optic nerve injury. Axotomy elevated lipin1 in retinal ganglion cells, which contributed to regeneration failure in the CNS by favorably producing triglyceride (TG) storage lipids rather than phospholipid (PL) membrane lipids in neurons. Regrowth induced by lipin1 depletion required TG hydrolysis and PL synthesis. Decreasing TG synthesis by deleting neuronal diglyceride acyltransferases (DGATs) and enhancing PL synthesis through the Kennedy pathway promoted axon regeneration. In addition, peripheral neurons adopted this mechanism for their spontaneous axon regeneration. Our study reveals a critical role of lipin1 and DGATs as intrinsic regulators of glycerolipid metabolism in neurons and indicates that directing neuronal lipid synthesis away from TG synthesis and toward PL synthesis may promote axon regeneration.

Keywords: DGAT1; DGAT2; Lipin1; axon regeneration; glycerolipid; phospholipid; retinal ganglion cell; triglyceride.


Conflict of interest statement

The authors declare no competing interests.

Figures

None
Graphical abstract
Figure 1
Figure 1
Lipin1 Depletion Promotes Axon Regeneration (A) Quantification of the axon elongation by in vitro screening of glycerol-3-phosphate (G3P) metabolic genes in adult DRG neurons. We tested five genes including lipin1, Gpat1, Agpat1, Agpat3, Agpat5. Gpat, Glycerol-3-phosphate acyltransferase. Agpat, 1-acyl-sn-glycerol-3-phosphate acyltransferase. Adult DRG neurons were dissociated and transfected with the plasmids for 3 days. Neurons were then replated and fixed 24 h after replating. DRG neurites were visualized by using Tuj1 staining. Three mice and 10–20 neurons from each mouse were quantified in each group. p ≤ 0.05, ANOVA followed by Dunnett’s test. (B) Representative images of replated neurons from control shRNA and lipin1 shRNA groups with Tuj1 staining. Scale bar: 400 μm. (C) Sections of optic nerves from WT mice at 2 weeks post-injury (WPI). The vitreous body was injected with either AAV-control-shRNA or AAV-lipin1-shRNA. Axons were labeled by CTB-FITC. Scale bar: 100 μm. (D) Number of regenerating axons at indicated distances distal to the lesion site. ∗∗p ≤ 0.01, ANOVA followed by Bonferroni’s test, n = 6 mice. (E) Sections of optic nerves from Rosa26-Cas9 mice at 2 WPI injected with either AAV-control-sgRNA or AAV-lipin1-sgRNA. Scale bar: 100 μm. (F) Number of regenerating axons at indicated distances from the lesion site. ∗∗p ≤ 0.01, ANOVA followed by Bonferroni’s test, n = 6 mice. (G) Sections of optic nerves from WT mice at 2 WPI injected with AAV-CNTF combined with either AAV-control or lipin1-shRNA. Scale bar: 400 μm. Zoomed-in images are shown in the bottom panel. (G′) Zoomed-in images are shown in the bottom panel. Scale bar: 400 μm. (G″) Zoomed-in images of optic chiasm from (G). Arrows indicate regenerating axons in optic chiasm. Scale bar: 200 μm. (H) Number of regenerating axons at indicated distances distal to the lesion site. ∗∗p ≤ 0.01, p ≤ 0.05, ANOVA followed by Bonferroni’s test, n = 6 mice. Error bars indicate SEM. See also Figure S1.
Figure 2
Figure 2
Lipin1 Levels Are Upregulated during Development and after Axotomy (A) Retinal sections from WT mice of different ages (1, 7, 21, and 50 days postnatal) were collected and stained with DAPI (blue), Tuj1 (green), and lipin1 (red). Scale bar: 10 μm. (B) Percentage of RGCs with a low or high lipin1 level at the indicated ages. ∗∗p ≤ 0.01, p ≤ 0.05, ns, not significant, ANOVA followed by Tukey’s test. (C) Whole-mount retinas from WT mice 3 days after axotomy or sham surgery were collected and stained for DAPI (blue), SMI32 (green), and lipin1 (red). Scale bar: 50 μm. Zoomed-in images are shown in the right panel. Scale bar: 10 μm. (D) Percentage of αRGCs with a low or high lipin1 level indicated by lipin1 staining. ∗∗p ≤ 0.01, ANOVA followed by Bonferroni’s test. Error bars indicate SEM. See also Figure S2.
Figure 3
Figure 3
Lipin1 Inhibits Axon Regeneration through Its Phosphatidate Phosphatase Activity and Regulates Glycerolipid Metabolism in Neurons (A) Schematic representation of the different lipin1 overexpression constructs used for the subsequent experiments. (B) Sections of optic nerves from WT mice at 2 WPI, injected with AAV-lipin1-shRNA combined with AAV-GFP, AAV-lipin1-WT, AAV-lipin1-PAPm, or AAV-lipin1-ΔNLS. Scale bar: 100 μm. (C) Number of regenerating axons at different distances distal to the lesion site. ∗∗p ≤ 0.01, p ≤ 0.05, ANOVA followed by Tukey’s test, n = 5–6 mice. (D) Heatmap represents the alteration of lipidomes after lipin1 KD in cortical neurons. Lipid species with the top 20 VIP are listed. Colors correspond to differences in relative abundance. (E and F) Total TG (E) and PC (F) levels in cortical neurons after AAV-control or lipin1-shRNA treatment. ∗∗p ≤ 0.01, p ≤ 0.05, Student’s t test. Error bars indicate SEM. See also Figure S3.
Figure 4
Figure 4
TG Hydrolysis Is Required for the Axon Regeneration Induced by lipin1 Depletion (A) Schematic showing the TG metabolism pathway in mammals. (B) Representative images of DRG neurons cultured with DMSO vehicle, Atglistatin, or KLH-45 for 3 days. BODIPY (green) staining was used to visualize lipid droplet distribution in neurons. Scale bar: 20 μm. (C) Sections of optic nerves from Rosa26-Cas9 mice with lipin1-sgRNA injection at 2 WPI combined with AAV-control or Atgl shRNA. Scale bar: 100 μm. (D) Number of regenerating axons at different distances distal to the lesion site. ∗∗p ≤ 0.01, ANOVA followed by Tukey’s test, n = 5–6 mice. (E) Sections of optic nerves from Rosa26-Cas9 mice with lipin1-sgRNA injection at 2 WPI combined with AAV-control or Ddhd2 shRNA. Scale bar: 100 μm. (F) Number of regenerating axons at different distances distal to the lesion site. p ≤ 0.05, ANOVA followed by Tukey’s test, n = 5–6 mice. Error bars indicate SEM. See also Figure S4.
Figure 5
Figure 5
TG Synthesis Inhibition Promotes Axon Regeneration (A) Retinal sections from WT mice 3 days after injury or sham surgery were collected and stained for Tuj1 (green) and DGAT1 (red). Scale bar: 50 μm. (B) Quantification of relative fluorescence intensity of DGAT1 staining in RGCs. p ≤ 0.05, Student’s t test, n = 5 mice. (C) Sections of optic nerves from Rosa26-Cas9 mice at 2 WPI. The vitreous body was injected with AAV-control, Dgat1, or Dgat2-sgRNA. Axons were labeled by CTB-FITC. Scale bar: 100 μm. (D) Numbers of regenerating axons in (C) at indicated distances distal to the lesion site. ∗∗p ≤ 0.01, ANOVA followed by Tukey’s test, n = 6 mice. (E and F) Levels of individual TG (E) and PC (F) species normalized to the total protein from either Ctrl or Dgat1-shRNA group. The molecular species are indicated as the total number of carbons: the number of double bonds. ∗∗p ≤ 0.01, p ≤ 0.05, t test, n = 6. (G and H) Levels of total TGs (G) or PCs (H) normalized to the total protein from either Ctrl or Dgat1-shRNA group. ∗∗p ≤ 0.01, p ≤ 0.05, ANOVA followed by Dunnett’s test, n = 6. (I) Quantification of regenerated axons in injured optic nerves from Rosa26-Cas9 mice injected with AAV-Dgat1 or Dgat2-sgRNA at 2 WPI, combined with AAV-control or Atgl shRNA. Shown are numbers of regenerating axons at the indicated distances distal to the lesion site. ∗∗p ≤ 0.01, ANOVA followed by Tukey’s test, n = 6 mice. Error bars indicate SEM. See also Figure S5.
Figure 6
Figure 6
PL Biosynthesis Is Essential for the Axon Regeneration Induced by lipin1 Depletion (A) Schematic showing the PL synthesis pathways in mammals. (B) Representative images of replated neurons from the respective groups with Tuj1 staining. Adult DRG neurons were dissociated and cultured with different AAV shRNA for 10 days. Neurons were then replated and fixed 24 h later. DRG neurites were visualized by Tuj1 staining. Scale bar: 400 μm. (C) Quantification of the length of the longest axon for each DRG neuron in (B). Three mice and 10–20 cells from each mouse were quantified in each group. ∗∗p ≤ 0.01, ANOVA followed by Tukey’s test. (D) Sections of optic nerves from Cas9 mice at 2 WPI. The vitreous body was injected with respective AAVs. Axons were labeled by CTB-FITC. Scale bar: 100 μm. (E) Number of regenerating axons at the indicated distances distal to the lesion site. ∗∗p ≤ 0.01, ANOVA followed by Tukey’s test, n = 6 mice. (F) Sections of optic nerves from WT mice at 2 WPI. The vitreous body was injected with AAV-GFP, Pcyt1a, Pcyt1a-CA, or Pcyt2. Axons were labeled by CTB-FITC. Scale bar: 100 μm. (G) Number of regenerating axons at the indicated distances distal to the lesion site. ∗∗p ≤ 0.01, ANOVA followed by Tukey’s test, n = 6 mice. Error bars indicate SEM. See also Figure S6.
Figure 7
Figure 7
TG Synthesis Inhibition Promotes Spontaneous Peripheral Axon Regeneration (A) DRG sections from WT animals 3 days after sciatic nerve crush or sham surgery, stained with Tuj1 (green) or DGAT1 (red) antibodies. Scale bar: 100 μm. Zoomed-in images are shown in the right panel. Scale bar: 20 μm. (B) Percentage of DGAT1+ DRG neurons in (A). ∗∗p ≤ 0.01, Student’s t test. (C) Representative images of DRG neurons in primary cultures treated with DMSO vehicle, Atglistatin (10 μM), or KLH-45 (10 μM). DRG neurites were visualized by Tuj1 staining. Scale bar: 400 μm. (D) Quantification of the length of the longest axon for each DRG neuron in (C). Three mice and 10–20 cells from each mouse were quantified in each group. ∗∗p ≤ 0.01, ANOVA followed by Dunnett’s test. (E) Sections of sciatic nerves from WT animals treated with DMSO, KLH-45, or KLH-45 combined with Atglistatin. Axons are visualized by SCG10 staining. Scale bar: 400 μm. (F) Quantification of regenerating sensory axons in (E). ∗∗p ≤ 0.01, p ≤ 0.05, ANOVA followed by Dunnett’s test. (G) A working model of the glycerol phosphate pathway in axon regeneration by using diagrams of glycerolipid metabolism redirection in intact, injured, or regenerating neurons. TG and PL metabolism maintains homeostasis in intact neurons. After CNS axonal injury, lipin1 and DGAT1 upregulation leads to TG accumulation in neurons and eventually inhibits axon regeneration. However, after lipin1 or DGAT1/2 inhibition, TG synthesis gives way to PL synthesis to support axon regeneration. See also Figure S7.

Comment in

References

    1. Aldskogius H. Lipid accumulation in axotomized adult rabbit vagal neurons. Electron microscopical observations. Brain Res. 1978;140:349–353. - PubMed
    1. Bazinet R.P., Layé S. Polyunsaturated fatty acids and their metabolites in brain function and disease. Nat. Rev. Neurosci. 2014;15:771–785. - PubMed
    1. Belin S., Nawabi H., Wang C., Tang S., Latremoliere A., Warren P., Schorle H., Uncu C., Woolf C.J., He Z., Steen J.A. Injury-induced decline of intrinsic regenerative ability revealed by quantitative proteomics. Neuron. 2015;86:1000–1014. - PMC - PubMed
    1. Blanquie O., Bradke F. Cytoskeleton dynamics in axon regeneration. Curr. Opin. Neurobiol. 2018;51:60–69. - PubMed
    1. Bloch K. The biological synthesis of cholesterol. Science. 1965;150:19–28. - PubMed

Publication types

MeSH terms