. 2019 Dec 16;29(24):4218-4230.e8.
doi: 10.1016/j.cub.2019.10.042. Epub 2019 Nov 27.

Serotonergic Modulation of Walking in Drosophila

Affiliations

Serotonergic Modulation of Walking in Drosophila

Clare E Howard et al. Curr Biol. .

Abstract

To navigate complex environments, animals must generate highly robust, yet flexible, locomotor behaviors. For example, walking speed must be tailored to the needs of a particular environment. Not only must animals choose the correct speed and gait, they must also adapt to changing conditions and quickly respond to sudden and surprising new stimuli. Neuromodulators, particularly the small biogenic amine neurotransmitters, have the ability to rapidly alter the functional outputs of motor circuits. Here, we show that the serotonergic system in the vinegar fly, Drosophila melanogaster, can modulate walking speed in a variety of contexts and also change how flies respond to sudden changes in the environment. These multifaceted roles of serotonin in locomotion are differentially mediated by a family of serotonergic receptors with distinct activities and expression patterns.

Keywords: 5-HT; 5-HT receptors; Drosophila; locomotion; neuromodulation; serotonin; startle response; walking; walking gaits.


Conflict of interest statement

Declaration of Interests

The authors declare no competing interests.

Figures
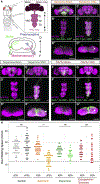
Figure 1.
Figure 1.. Neuromodulators in the Drosophila CNS.
A. The adult Drosophila CNS is composed of the brain and the VNC, which consists of three pairs of thoracic neuropils (T1, T2 and T3), each of which corresponds to a pair of adult legs, and an abdominal ganglion. The anterior (A)-posterior (P) axis is specified. Lower panel: Cross section of a thoracic neuropil illustrating projections of locomotor circuit components, including motor neurons, and sensory neurons that convey mechanosensory and proprioceptive information from the legs. The dorsal (D)– ventral (V) axis is specified. B-G. Maximum intensity projections show the expression patterns driven by Gal4 lines labeling either brain-derived (B, D, F, Gal4 intersected with tsh Gal80) or VNC-derived (C, E, G, Gal4 intersected with tsh) serotonergic (B-C, Trh Gal4), dopaminergic (D-E, TH Gal4), or octopaminergic/tyraminergic (OA/Tyr) (F-G, Tdc2 Gal4) neurons. (B”-G”) Projection of a subset of cross sections of the VNC shows innervation of the T1 neuropil. Arrowheads point to innervation in the leg neuropils. All scale bars are 50 μm. H. Optogenetic activation of serotonergic (Trhtsh > csChrimson) neurons in the Drosophila VNC, but not dopaminergic (THtsh > csChrimson) or octopaminergic/tyraminergic (Tdc2tsh > csChrimson) neurons, slows walking speed compared to all-trans-retinal (ATR) negative and non-Gal4 (w1118tsh > csChrimson) controls. These experiments were carried out using the Flywalker assay (Mendes et al., 2013; see Figure S3 A for a schematic). * p<.05 **p<.01 ***p<.001 by Kruskal-wallis test with Dunn-Sidak correction for multiple comparisons. N walking bouts (animals) w1118 ATR− 55 (14–31); w1118 ATR+ 52 (14–36); Trh ATR− 56 (12–30); Trh ATR+ 47 (10–23); TH ATR− 33 (10–24); TH ATR+ 25 (10–26); Tdc2 ATR− 27 (10–27); Tdc2 ATR+ 24 (10–25). See also Figure S1.
Figure 2.
Figure 2.. 5-HTVNC neurons modulate walking speed.
A. Activation of 5-HTVNC neurons (Trh ∩ tsh > csChrimson fed with ATR) causes animals to walk slower than background matched non-Gal4 controls (w1118 ∩ tsh >csChrimson fed with ATR). ***p<.001 by Kruskal-wallis test. Red box indicates median. N = 130 animals for each genotype. B. Inactivation of 5-HTVNC neurons (Trh ∩ tsh > Kir2.1) causes animals to walk faster than background matched non-Gal4 controls (w1118 ∩ tsh > Kir2.1). ***p<.001 by Kruskal-wallis test. Red box indicates median. N=119 animals per genotype. C. The distribution of velocity shifts caused by activation and inhibition of 5-HTVNC neurons are symmetrical. Differences in population average histograms were calculated between control and experimental genotypes and were fit with 95% confidence intervals via bootstrapping. For activation experiments, behavior of w1118 ∩ tsh >csChrimson flies fed with ATR was compared to that of Trh ∩ tsh >csChrimson flies also fed with ATR for the light on period only. D, E. Serotonergic processes passing through the cervical connective (labeled using Trh ∩ tsh) are active during walking. (D) A single animal’s forward velocity with overlaid boxes showing defined walking bouts. (E) While tdTomato baseline signal (purple line) is not affected by walking bouts, the calcium signal (green line) in these serotonergic processes rises during walking bouts (gray boxes). F. Calcium signal but not tdTomato signal in these processes rises with the onset of walking bouts. For each animal, all walking bouts were synchronized around their onset, and an average was taken (between 80 and 130 walking bouts per animal). Plotted is the average of all animals (N=5) with a 95% confidence interval representing the spread between animals. See also Figures S2 and S3.
Figure 3.
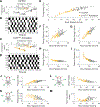
Figure 3.. Walking is coordinated when 5-HTVNC neurons are activated.
A-D. Representative data from speed-matched slow (19 mm/s) walking bouts show that activation of 5-HTVNC neurons does not disrupt locomotor coordination. Footfalls (filled circles) and stance traces (lines) for all steps taken by the left front, middle, and hind legs show foot touchdown placement is consistent over time and stance traces are relatively straight in both control animals (Trh ∩ tsh >csChrimson grown on food lacking ATR) (A) and animals where 5-HTvnc neurons have been activated (Trh ∩ tsh >csChrimson fed with ATR) (C). Step trace for each leg during a walking bout for control (B) and experimental (D) animals. Stance phase is indicated in white and swing phase in black. The checkerboard pattern is consistent with a highly-coordinated walking gait. E-I. Quantification of step parameters upon activation of 5-HTVNC neurons. The relationships between speed and frequency (E), swing velocity (F), step length (G), swing duration (H), and stance duration (I) extend the trends observed with control flies. N=47 bouts from 10–23 animals for Trh ∩ tsh >csChrimson ATR+ (yellow circles). N=56 bouts from 12–30 animals for Trh ∩ tsh >csChrimson ATR− (gray circles). Speed by ATR interaction effect in multivariable model: frequency (p<.001), swing velocity (p=.02), step length (p=.53), swing duration (p<.001), stance duration (p=.71). J-M. Quantification of gait selection upon activation of 5-HTVNC neurons. Activation of 5-HTVNC neurons increases wave (L) and tetrapod (K) gait utilization while decreasing time spent using tripod (J) gait. There is a low frequency of non-canonical gait conformations upon activation (M). N=47 bouts from 10–23 animals for Trh ∩ tsh >csChrimson ATR+ (yellow circles). N=56 bouts from 12–30 animals for Trh ∩ tsh >csChrimson ATR− (gray circles). Speed by ATR interaction effect in multivariable model: tripod index (p<.001), tetrapod index (p=.60), wave index (p<.001), non canonical (p=.006). See also Figure S4.
Figure 4.
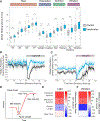
Figure 4.. Changes in walking behavior when 5-HTVNC neurons are silenced.
A. Silencing 5-HTVNC neurons (Trh ∩ tsh > Kir2.1) causes an increase in walking speed compared to genetically background matched non-Gal4 controls (w1118 ∩ tsh > Kir2.1) across a diversity of behavioral contexts including different temperatures, orientations, nutritional states, and vibration stimuli. For each condition, genotypes were compared using a Kruskal Wallis test, ***p<.001, **p<.01, *p<.05 by Kruskal-wallis test. For all conditions, p<.001 for context effects for both control and experimental genotypes.18 °C, N=130 per genotype; 25 °C, N=120 per genotype; 30 °C, N=120 per genotype; 37 °C, N= w1118 (120) Trh (119); upright, N=90 per genotype; inverted w1118 (74) Trh (70); fed, N=86 per genotype; starved, N= w1118 (86) Trh (85); vibration, N= w1118 (165) Trh (164). B-C. Silencing 5-HTVNC neurons changes the immediate behavioral responses to sudden contextual changes. When lights switch from on to off (B), control animals (w1118 ∩ tsh > Kir2.1, shown in black) show a brief behavioral pause and then resume activity. When 5-HTVNC neurons are silenced (Trh ∩ tsh > Kir2.1, shown in blue), animals still slow their speed but do not fully pause. In response to the onset of vibration (C) control animals stop, pause and then accelerate speed. When 5-HTVNC neurons are silenced (Trh ∩ tsh > Kir2.1, shown in blue), animals pause but re-accelerate more quickly than controls. Shaded areas show 95% confidence intervals. For light experiments, N= w1118 (150) Trh (140); for vibration experiments N=w1118 (167) Trh (166). D. Schematic of behaviors in response to a sudden stimulus. This response is divided into four key parameters that describe different phases of the response, indicated with arrows and bounded lines. E-F. Heatmaps quantifying the parameters schematized in (D) when 5-HTVNC neurons are inactivated in response to the blackout (E) and earthquake (f) scenarios. Plotted for every genotype is the difference in mean ranks (Kruskal-wallis test statistics) for each parameter compared to w1118 ∩ tsh > Kir2.1 control flies. Starred parameters are those where differences between control and experimental animals consistently reached significance (p<.05; see STAR Methods). See also Figure S5.
Figure 5.
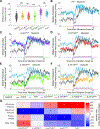
Figure 5.. Phenotype of the startle response of Trh and serotonin receptor mutants.
A. Dotplot showing median population walking speed during a five-minute recording session for Trh01 mutants (blue), which walk faster than background matched isoCS controls (black), consistent with the 5-HTVNC inactivation experiments. 5-HT7Gal4 mutants (purple) also walk faster than controls, but the other receptor mutants do not. ***p<.001, **p<.01, *p<.05 ns p>.05 by Kruskal-wallis analysis with Dunn-sidak correction for multiple comparisons. Brown box indicates median. N= isoCS (130) 5-HT1AGal4 (130) 5-HT1BGal4 (120) 5-HT2AGal4 (100) 5-HT7Gal4 (120) Trh01 (120). B-F. Median population walking speed sampled at 30 Hz in response to vibration stimulus. Trh01 mutants (B, blue line) show a blunted and shortened pause in response to the novel stimulus. 5-HT7Gal4 mutants (C, purple line) and 5-HT1BGal4 mutants (D, red line) show a similar phenotype to Trh01 mutants. 5-HT2AGal4 mutants (E, green line) and 5-HT1AGal4 mutants (F, yellow line) have a pause phase comparable to controls, but do not accelerate as much in response to the vibration stimulus. N= isoCS (140) 5-HT1AGal4 (115) 5-HT1BGal4 (124) 5-HT2AGal4 (88) 5-HT7Gal4 (120) Trh01 (139) G. Heatmap showing how lack of Trh or serotonergic receptors affects the response to vibration stimulus. Plotted for every genotype is the difference in mean ranks (Kruskal-wallis test with Dunn-sidak correction for multiple comparisons statistics) for each parameter compared to isoCS control flies. Starred parameters are those where differences between control and experimentals consistently reached significance (p<.05, see STAR Methods). See also Figure S5.
Figure 6.
Figure 6.. Differential expression of serotonin receptors in locomotor circuit components.
A-E. Maximum intensity projections show Gal4-driven expression of serotonin receptors in both the brain (A-E) and VNC (A’-E’). All scale bars are 50 μm. F. Schematic of sensory and motor neuron populations in an adult leg. G-K. Maximum intensity projections show Gal4-driven expression of serotonin receptors in neuronal processes in the adult leg. Each receptor is expressed in a distinct pattern in sensory-motor components. While some are expressed in motor neurons (purple arrows, hatched arrows indicate limited or weak expression) and proprioceptive neurons (green arrows), others are not. All receptors are expressed in a subset of mechanosensory neurons (orange arrows), but some are preferentially expressed in proximal or distal leg segments. All scale bars are 50 μm. See also Figure S6.

Similar articles

Cited by

References

    1. Ritzmann RE, and Büschges A (2007). Adaptive motor behavior in insects. Curr. Opin. Neurobiol 17, 629–636. - PubMed
    1. Ritzmann RE, Quinn RD, and Fischer MS (2004). Convergent evolution and locomotion through complex terrain by insects, vertebrates and robots. Arthropod Struct Dev 33, 361–379. - PubMed
    1. Mendes CS, Rajendren SV, Bartos I, Márka S, and Mann RS (2014). Kinematic responses to changes in walking orientation and gravitational load in Drosophila melanogaster. PLoS ONE 9, e109204. - PMC - PubMed
    1. Bidaye SS, Machacek C, Wu Y, and Dickson BJ (2014). Neuronal control of Drosophila walking direction. Science 344, 97–101. - PubMed
    1. Isakov A, Buchanan SM, Sullivan B, Ramachandran A, Chapman JKS, Lu ES, Mahadevan L, and de Bivort B (2016). Recovery of locomotion after injury in Drosophila depends on proprioception. J. Exp. Biol - PubMed

Publication types

LinkOut - more resources