

Mitonuclear conflict and cooperation govern the integration of genotypes, phenotypes and environments
- PMID: 31787039
- PMCID: PMC6939372
- DOI: 10.1098/rstb.2019.0188
Mitonuclear conflict and cooperation govern the integration of genotypes, phenotypes and environments
Abstract
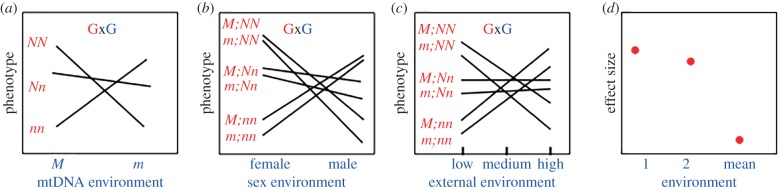
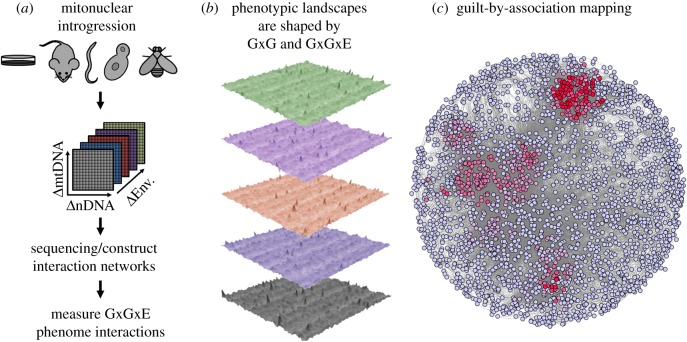
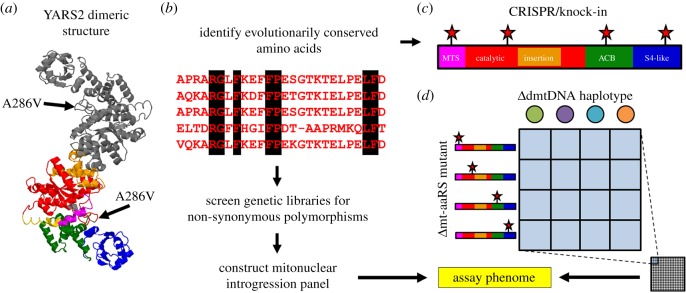
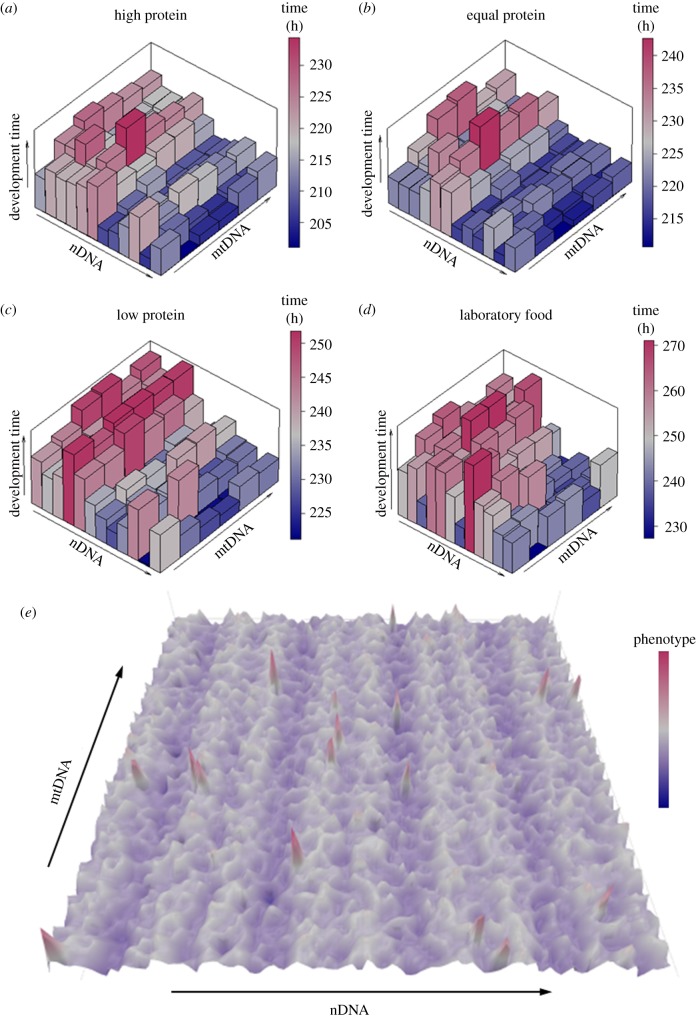
The mitonuclear genome is the most successful co-evolved mutualism in the history of life on Earth. The cross-talk between the mitochondrial and nuclear genomes has been shaped by conflict and cooperation for more than 1.5 billion years, yet this system has adapted to countless genomic reorganizations by each partner, and done so under changing environments that have placed dramatic biochemical and physiological pressures on evolving lineages. From putative anaerobic origins, mitochondria emerged as the defining aerobic organelle. During this transition, the two genomes resolved rules for sex determination and transmission that made uniparental inheritance the dominant, but not a universal pattern. Mitochondria are much more than energy-producing organelles and play crucial roles in nutrient and stress signalling that can alter how nuclear genes are expressed as phenotypes. All of these interactions are examples of genotype-by-environment (GxE) interactions, gene-by-gene (GxG) interactions (epistasis) or more generally context-dependent effects on the link between genotype and phenotype. We provide evidence from our own studies in Drosophila, and from those of other systems, that mitonuclear interactions-either conflicting or cooperative-are common features of GxE and GxG. We argue that mitonuclear interactions are an important model for how to better understand the pervasive context-dependent effects underlying the architecture of complex phenotypes. Future research in this area should focus on the quantitative genetic concept of effect size to place mitochondrial links to phenotype in a proper context. This article is part of the theme issue 'Linking the mitochondrial genotype to phenotype: a complex endeavour'.
Keywords: GxE; GxG; conflict; cooperation; epistasis; mitonuclear.
Conflict of interest statement
We declare we have no competing interests.
Figures
Similar articles
-
Mitonuclear epistasis, genotype-by-environment interactions, and personalized genomics of complex traits in Drosophila.IUBMB Life. 2018 Dec;70(12):1275-1288. doi: 10.1002/iub.1954. Epub 2018 Nov 5. IUBMB Life. 2018. PMID: 30394643 Free PMC article.
-
Mitochondria as environments for the nuclear genome in Drosophila: mitonuclear G×G×E.J Hered. 2022 Feb 17;113(1):37-47. doi: 10.1093/jhered/esab066. J Hered. 2022. PMID: 34964900 Free PMC article.
-
Mitonuclear Interactions Mediate Transcriptional Responses to Hypoxia in Drosophila.Mol Biol Evol. 2017 Feb 1;34(2):447-466. doi: 10.1093/molbev/msw246. Mol Biol Evol. 2017. PMID: 28110272 Free PMC article.
-
Mitonuclear interactions: evolutionary consequences over multiple biological scales.Philos Trans R Soc Lond B Biol Sci. 2014 Jul 5;369(1646):20130443. doi: 10.1098/rstb.2013.0443. Philos Trans R Soc Lond B Biol Sci. 2014. PMID: 24864313 Free PMC article. Review.
-
Mitonuclear Mate Choice: A Missing Component of Sexual Selection Theory?Bioessays. 2018 Mar;40(3). doi: 10.1002/bies.201700191. Epub 2018 Feb 6. Bioessays. 2018. PMID: 29405334 Review.
Cited by
-
Mitochondrial Short-Term Plastic Responses and Long-Term Evolutionary Dynamics in Animal Species.Genome Biol Evol. 2021 Jul 6;13(7):evab084. doi: 10.1093/gbe/evab084. Genome Biol Evol. 2021. PMID: 33892508 Free PMC article. Review.
-
Extreme heterogeneity of human mitochondrial DNA from organelles to populations.Nat Rev Genet. 2021 Feb;22(2):106-118. doi: 10.1038/s41576-020-00284-x. Epub 2020 Sep 28. Nat Rev Genet. 2021. PMID: 32989265 Review.
-
MtDNA sequence features associated with 'selfish genomes' predict tissue-specific segregation and reversion.Nucleic Acids Res. 2020 Sep 4;48(15):8290-8301. doi: 10.1093/nar/gkaa622. Nucleic Acids Res. 2020. PMID: 32716035 Free PMC article.
-
Impact of mitonuclear interactions on life-history responses to diet.Philos Trans R Soc Lond B Biol Sci. 2020 Jan 20;375(1790):20190416. doi: 10.1098/rstb.2019.0416. Epub 2019 Dec 2. Philos Trans R Soc Lond B Biol Sci. 2020. PMID: 31787037 Free PMC article.
-
Mitochondrial effects on fertility and longevity in Tigriopus californicus contradict predictions of the mother's curse hypothesis.Proc Biol Sci. 2022 Nov 30;289(1987):20221211. doi: 10.1098/rspb.2022.1211. Epub 2022 Nov 16. Proc Biol Sci. 2022. PMID: 36382523 Free PMC article.
References
-
- Kaidanov LZ. 1989. Animal population genetics. In Population genetics and population ethology: (Physiology and general biology reviews, vol. 3, part 4) (eds Kaidanov LZ, Panov EN), p. 223 Amsterdam, The Netherlands: Harwood Academic Publishers.
-
- Lane N. 2005. Power, sex, suicide: mitochondria and the meaning of life. Oxford, UK: Oxford University Press.
-
- Cosmides LM, Tooby J. 1981. Cytoplasmic inheritance and intragenomic conflict. J. Theor. Biol. 89, 83–129. - PubMed
Publication types
MeSH terms
Grants and funding
LinkOut - more resources
Full Text Sources
Molecular Biology Databases
