

The conflict within: origin, proliferation and persistence of a spontaneously arising selfish mitochondrial genome
- PMID: 31787044
- PMCID: PMC6939371
- DOI: 10.1098/rstb.2019.0174
The conflict within: origin, proliferation and persistence of a spontaneously arising selfish mitochondrial genome
Abstract
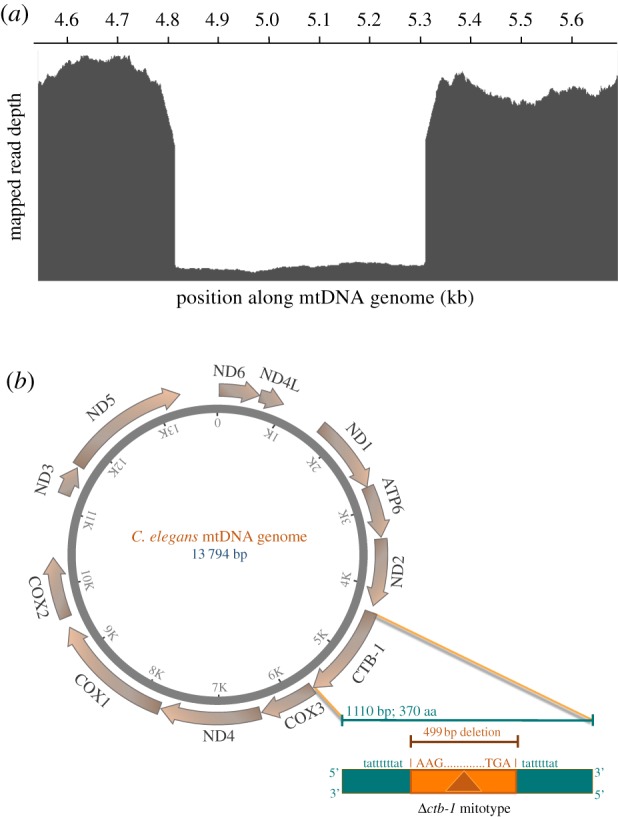
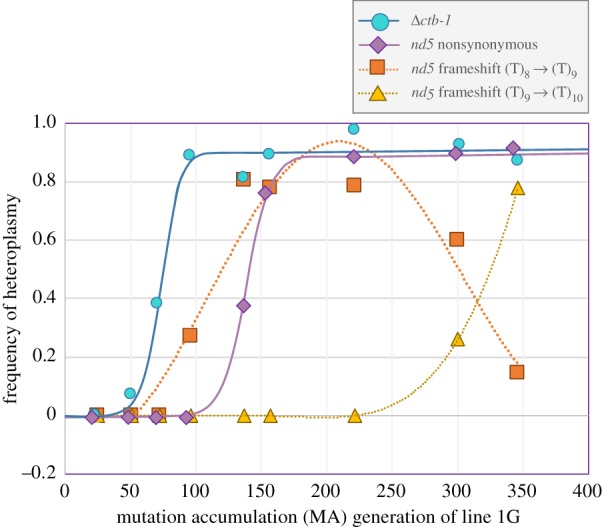
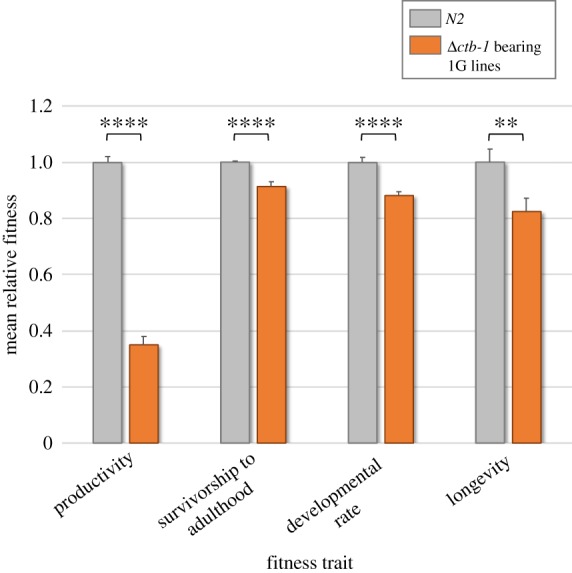
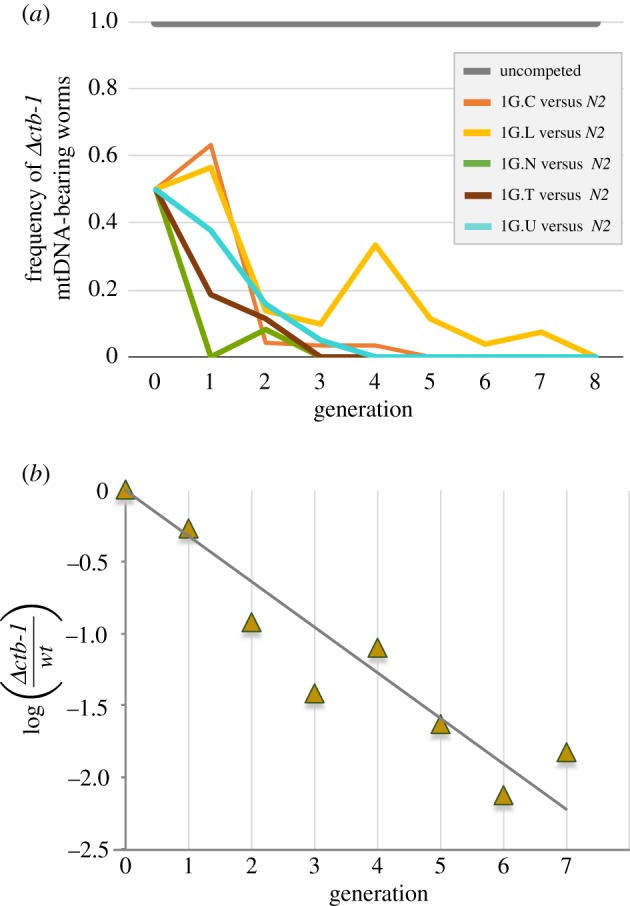
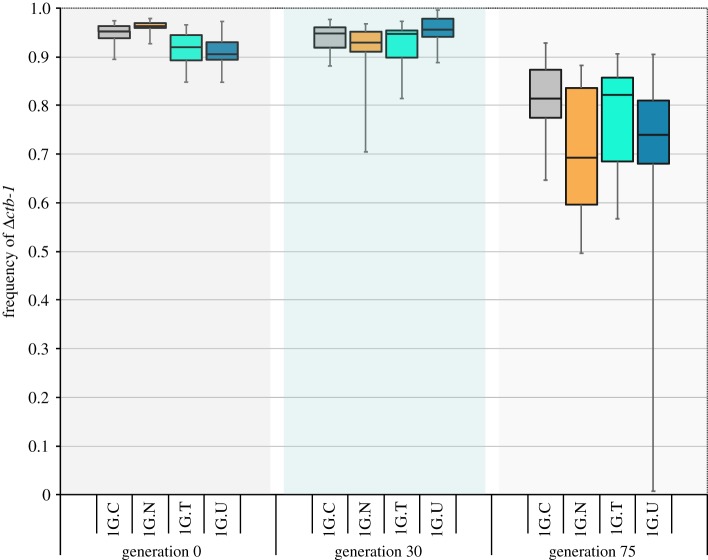
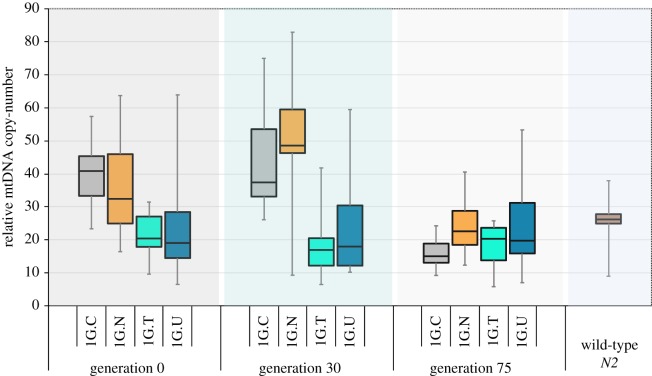
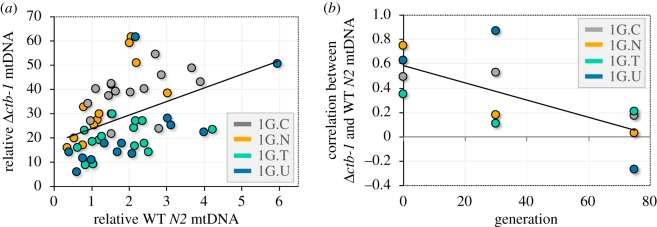
Mitochondrial genomes can sustain mutations that are simultaneously detrimental to individual fitness and yet, can proliferate within individuals owing to a replicative advantage. We analysed the fitness effects and population dynamics of a mitochondrial genome containing a novel 499 bp deletion in the cytochrome b(1) (ctb-1) gene (Δctb-1) encoding the cytochrome b of complex III in Caenorhabditis elegans. Δctb-1 reached a high heteroplasmic frequency of 96% in one experimental line during a mutation accumulation experiment and was linked to additional spontaneous mutations in nd5 and tRNA-Asn. The Δctb-1 mutant mitotype imposed a significant fitness cost including a 65% and 52% reduction in productivity and competitive fitness, respectively, relative to individuals bearing wild-type (WT) mitochondria. Deletion-bearing worms were rapidly purged within a few generations when competed against WT mitochondrial DNA (mtDNA) bearing worms in experimental populations. By contrast, the Δctb-1 mitotype was able to persist in large populations comprising heteroplasmic individuals only, although the average intracellular frequency of Δctb-1 exhibited a slow decline owing to competition among individuals bearing different frequencies of the heteroplasmy. Within experimental lines subjected to severe population bottlenecks (n = 1), the relative intracellular frequency of Δctb-1 increased, which is a hallmark of selfish drive. A positive correlation between Δctb-1 and WT mtDNA copy-number suggests a mechanism that increases total mtDNA per se, and does not discern the Δctb-1 mitotype from the WT mtDNA. This study demonstrates the selfish nature of the Δctb-1 mitotype, given its transmission advantage and substantial fitness load for the host, and highlights the importance of population size for the population dynamics of selfish mtDNA. This article is part of the theme issue 'Linking the mitochondrial genotype to phenotype: a complex endeavour'.
Keywords: fitness; genomic conflict; heteroplasmy; mitochondrial deletion; selection; selfish genetic element.
Conflict of interest statement
The authors declare no competing financial or other interests.
Figures
Similar articles
-
Nutrient status shapes selfish mitochondrial genome dynamics across different levels of selection.Elife. 2020 Sep 22;9:e56686. doi: 10.7554/eLife.56686. Elife. 2020. PMID: 32959778 Free PMC article.
-
Dissecting the sequential evolution of a selfish mitochondrial genome in Caenorhabditis elegans.Heredity (Edinb). 2024 Sep;133(3):186-197. doi: 10.1038/s41437-024-00704-2. Epub 2024 Jul 5. Heredity (Edinb). 2024. PMID: 38969772 Free PMC article.
-
Friend turned foe: selfish behavior of a spontaneously arising mitochondrial deletion in an experimentally evolved Caenorhabditis elegans population.G3 (Bethesda). 2024 Apr 3;14(4):jkae018. doi: 10.1093/g3journal/jkae018. G3 (Bethesda). 2024. PMID: 38261394 Free PMC article.
-
Intracellular quality control of mitochondrial DNA: evidence and limitations.Philos Trans R Soc Lond B Biol Sci. 2020 Jan 20;375(1790):20190176. doi: 10.1098/rstb.2019.0176. Epub 2019 Dec 2. Philos Trans R Soc Lond B Biol Sci. 2020. PMID: 31787047 Free PMC article. Review.
-
A battle for transmission: the cooperative and selfish animal mitochondrial genomes.Open Biol. 2019 Mar 29;9(3):180267. doi: 10.1098/rsob.180267. Open Biol. 2019. PMID: 30890027 Free PMC article. Review.
Cited by
-
Nutrient status shapes selfish mitochondrial genome dynamics across different levels of selection.Elife. 2020 Sep 22;9:e56686. doi: 10.7554/eLife.56686. Elife. 2020. PMID: 32959778 Free PMC article.
-
Dissecting the sequential evolution of a selfish mitochondrial genome in Caenorhabditis elegans.Heredity (Edinb). 2024 Sep;133(3):186-197. doi: 10.1038/s41437-024-00704-2. Epub 2024 Jul 5. Heredity (Edinb). 2024. PMID: 38969772 Free PMC article.
-
Effects of mating system and adaptedness on the evolution of fitness and mtDNA copy number in mitonuclear mismatched C. elegans.Heredity (Edinb). 2025 Jul 28. doi: 10.1038/s41437-025-00786-6. Online ahead of print. Heredity (Edinb). 2025. PMID: 40721646
-
Mitochondrial respiratory function is preserved under cysteine starvation via glutathione catabolism in NSCLC.Nat Commun. 2024 May 18;15(1):4244. doi: 10.1038/s41467-024-48695-2. Nat Commun. 2024. PMID: 38762605 Free PMC article.
-
Friend turned foe: selfish behavior of a spontaneously arising mitochondrial deletion in an experimentally evolved Caenorhabditis elegans population.G3 (Bethesda). 2024 Apr 3;14(4):jkae018. doi: 10.1093/g3journal/jkae018. G3 (Bethesda). 2024. PMID: 38261394 Free PMC article.
References
-
- Gray MW. 2018. Mitochondrial genomes. In Molecular life sciences (eds Wells RD, Bond JS, Klinman J, Masters BSS), pp. 695–709. New York, NY: Springer.
-
- Burton RS, Pereira RJ, Barreto FS. 2013. Cytonuclear genomic interactions and hybrid breakdown. Annu. Rev. Ecol. Evol. Syst. 44, 281–302. (10.1146/annurev-ecolsys-110512-135758) - DOI
Publication types
MeSH terms
Substances
Associated data
LinkOut - more resources
Full Text Sources
