

Powerhouses in the cold: mitochondrial function during thermal acclimation in montane mayflies
- PMID: 31787050
- PMCID: PMC6939376
- DOI: 10.1098/rstb.2019.0181
Powerhouses in the cold: mitochondrial function during thermal acclimation in montane mayflies
Abstract
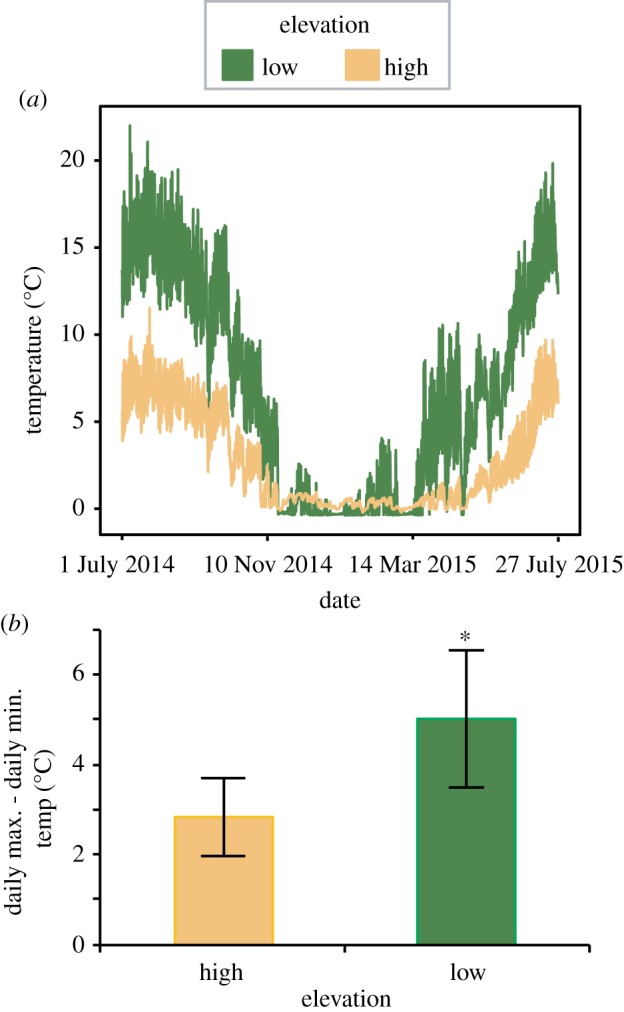
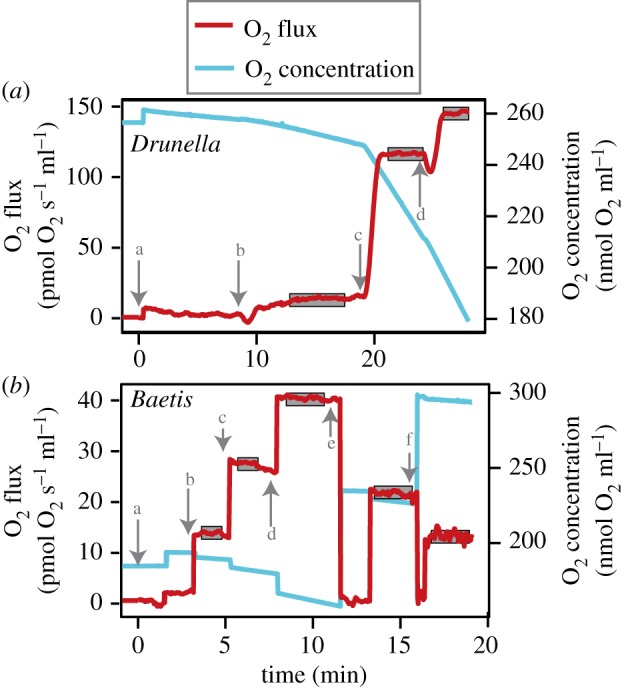
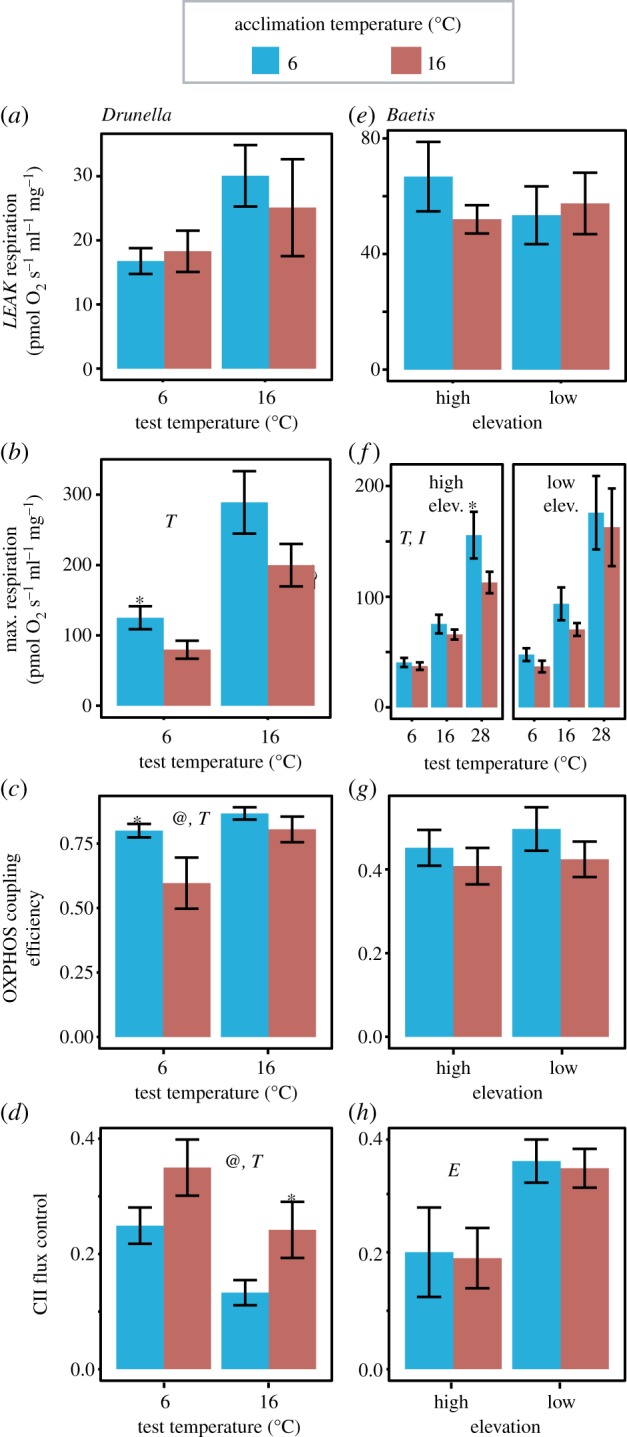
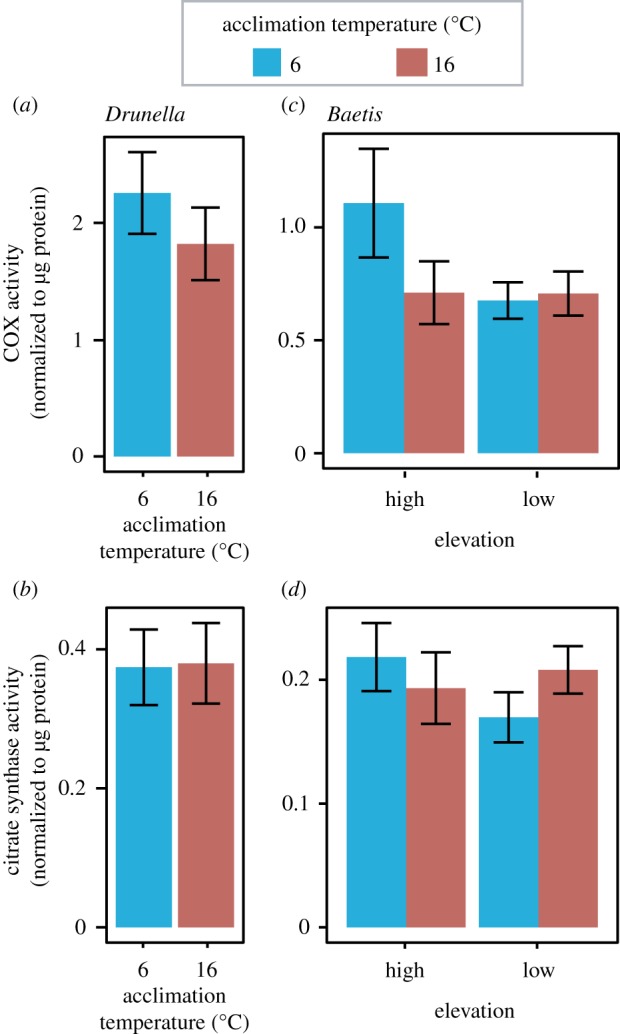
Mitochondria provide the vast majority of cellular energy available to eukaryotes. Therefore, adjustments in mitochondrial function through genetic changes in mitochondrial or nuclear-encoded genes might underlie environmental adaptation. Environmentally induced plasticity in mitochondrial function is also common, especially in response to thermal acclimation in aquatic systems. Here, we examined mitochondrial function in mayfly larvae (Baetis and Drunella spp.) from high and low elevation mountain streams during thermal acclimation to ecologically relevant temperatures. A multi-substrate titration protocol was used to evaluate different respiratory states in isolated mitochondria, along with cytochrome oxidase and citrate synthase activities. In general, maximal mitochondrial respiratory capacity and oxidative phosphorylation coupling efficiency decreased during acclimation to higher temperatures, suggesting montane insects may be especially vulnerable to rapid climate change. Consistent with predictions of the climate variability hypothesis, mitochondria from Baetis collected at a low elevation site with highly variable daily and seasonal temperatures exhibited greater thermal tolerance than Baetis from a high elevation site with comparatively stable temperatures. However, mitochondrial phenotypes were more resilient than whole-organism phenotypes in the face of thermal stress. These results highlight the complex relationships between mitochondrial and organismal genotypes, phenotypes and environmental adaptation. This article is part of the theme issue 'Linking the mitochondrial genotype to phenotype: a complex endeavour'.
Keywords: G × E effects; Oroboros Oxygraph 2k; climate variability hypothesis; flux control factor; mitochondrial respiration; thermal tolerance.
Conflict of interest statement
We declare we have no competing interests.
Figures
Similar articles
-
Thermal Acclimation Ability Varies in Temperate and Tropical Aquatic Insects from Different Elevations.Integr Comp Biol. 2017 Nov 1;57(5):977-987. doi: 10.1093/icb/icx101. Integr Comp Biol. 2017. PMID: 29087493
-
Do mitochondrial properties explain intraspecific variation in thermal tolerance?J Exp Biol. 2009 Feb;212(Pt 4):514-22. doi: 10.1242/jeb.024034. J Exp Biol. 2009. PMID: 19181899
-
Mechanisms and costs of mitochondrial thermal acclimation in a eurythermal killifish (Fundulus heteroclitus).J Exp Biol. 2015 Jun;218(Pt 11):1621-31. doi: 10.1242/jeb.120444. Epub 2015 Apr 7. J Exp Biol. 2015. PMID: 25852066
-
Climate variations and the physiological basis of temperature dependent biogeography: systemic to molecular hierarchy of thermal tolerance in animals.Comp Biochem Physiol A Mol Integr Physiol. 2002 Aug;132(4):739-61. doi: 10.1016/s1095-6433(02)00045-4. Comp Biochem Physiol A Mol Integr Physiol. 2002. PMID: 12095860 Review.
-
The Mitochondrial Basis for Adaptive Variation in Aerobic Performance in High-Altitude Deer Mice.Integr Comp Biol. 2018 Sep 1;58(3):506-518. doi: 10.1093/icb/icy056. Integr Comp Biol. 2018. PMID: 29873740 Review.
Cited by
-
Mitochondrial metabolism in blood more reliably predicts whole-animal energy needs compared to other tissues.iScience. 2023 Oct 23;26(12):108321. doi: 10.1016/j.isci.2023.108321. eCollection 2023 Dec 15. iScience. 2023. PMID: 38025793 Free PMC article.
-
Rising floor and dropping ceiling: organ heterogeneity in response to cold acclimation of the largest extant amphibian.Proc Biol Sci. 2022 Oct 12;289(1984):20221394. doi: 10.1098/rspb.2022.1394. Epub 2022 Oct 5. Proc Biol Sci. 2022. PMID: 36196548 Free PMC article.
-
Faraway, so close. The comparative method and the potential of non-model animals in mitochondrial research.Philos Trans R Soc Lond B Biol Sci. 2020 Jan 20;375(1790):20190186. doi: 10.1098/rstb.2019.0186. Epub 2019 Dec 2. Philos Trans R Soc Lond B Biol Sci. 2020. PMID: 31787048 Free PMC article.
-
Linking the mitochondrial genotype to phenotype: a complex endeavour.Philos Trans R Soc Lond B Biol Sci. 2020 Jan 20;375(1790):20190169. doi: 10.1098/rstb.2019.0169. Epub 2019 Dec 2. Philos Trans R Soc Lond B Biol Sci. 2020. PMID: 31787041 Free PMC article.
-
Prenatal acoustic programming of mitochondrial function for high temperatures in an arid-adapted bird.Proc Biol Sci. 2021 Dec 8;288(1964):20211893. doi: 10.1098/rspb.2021.1893. Epub 2021 Dec 8. Proc Biol Sci. 2021. PMID: 34875198 Free PMC article.
References
Publication types
MeSH terms
Grants and funding
LinkOut - more resources
Full Text Sources
Miscellaneous
